Figures & data
Table 1 Different Primers Used in This Work
Figure 1 Phylogenetic analysis of NS5B (A) and 5ʹUTR (B) sequences illustrating the molecular epidemiology and evolution of HCV genotypes. The phylogenetic tree was constructed in Mega 4 program using the neighbour-joining method and the phylogeny test was 1000 times bootstrapped.
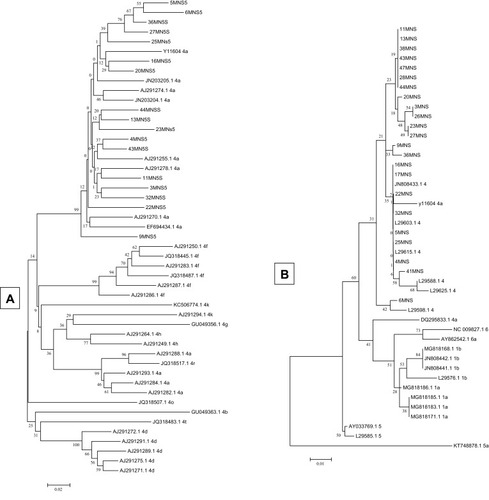
Table 2 Amino Acid Sequence Variation Analysis of NS5B Region of 17 Isolates Compared to a Standard Strain
Figure 2 Diphosphate forms of the HCV nucleotide inhibitors chosen for model validation.
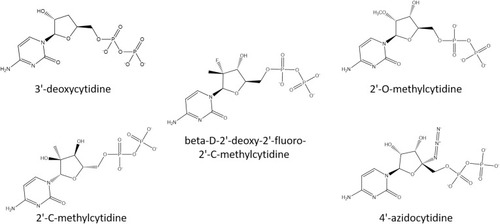
Figure 3 Correlation between docking scores and nucleotide inhibitor activity.
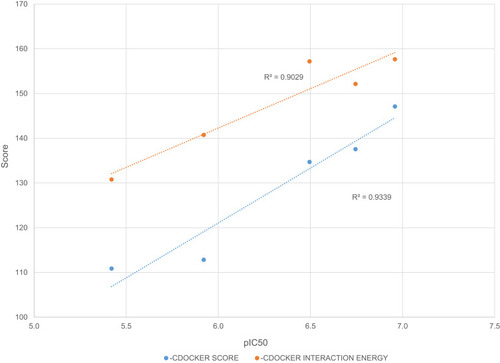
Figure 4 3D and 2D interaction patterns for SOF (A), UDP (B) and ribavirin (C). Dock poses (purple) and crystal structure poses (green) shown in stick form, interacting residues (light green) and RNA nucleotides (orange) shown as lines. Mn2+ ions shown as light blue stars. Image prepared in BIOVIA Discovery Studio.
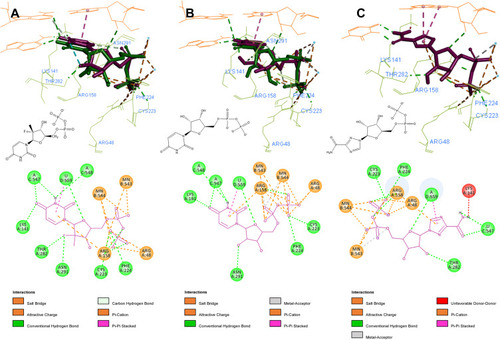
Figure 5 Positions of detected amino acid variations in the created homology model. HCV NS5B structure colored according to its domains: fingers – purple, palm – sky blue, thumb – green, C-terminal – orange. Nucleoside binding pocket represented as a red circle (8 Å radius). Occurring amino acid variations represented as spheres; orange – occurring in all of the sequenced isolates; green – occurring in some of the sequenced isolates. Image prepared in BIOVIA Discovery Studio.
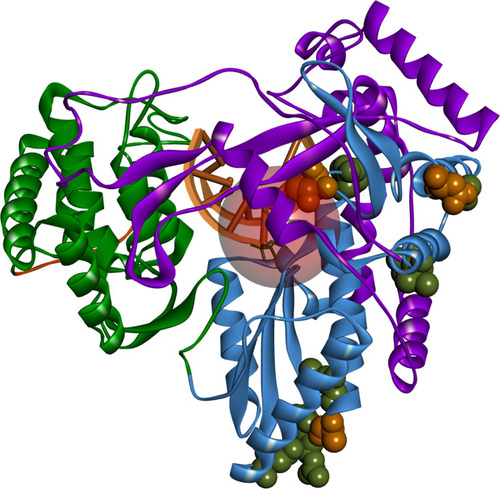
Figure 6 3D interaction pattern of F285 (shown as purple stick). Interacting residues colored in light green, RNA strand shown in orange, UDP shown as green stick. Hydrogen atoms and other protein residues hidden for clarity. Image prepared in BIOVIA Discovery Studio.
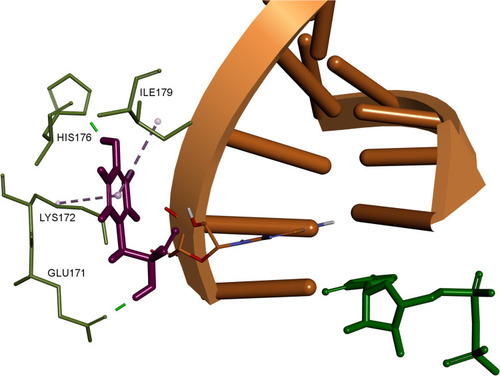
Table 3 Results of Mutation Energy of Binding Calculations
Figure 7 Sequence alignment of HCV NS5B sequences for genotypes 1, 2, and 4. Amino acids colored based on similarity. Residues within 8 Å of the nucleotide binding site are highlighted in black. Image prepared using BIOVIA Discovery Studio.
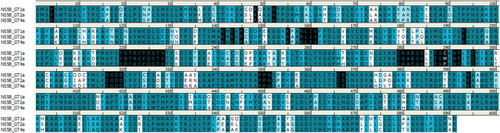
Figure 8 Structural basis of S282T SOF resistance mutation in HCV genotype 2a. Image prepared on the basis of 4WTA crystal structure in BIOVIA Discovery Studio.
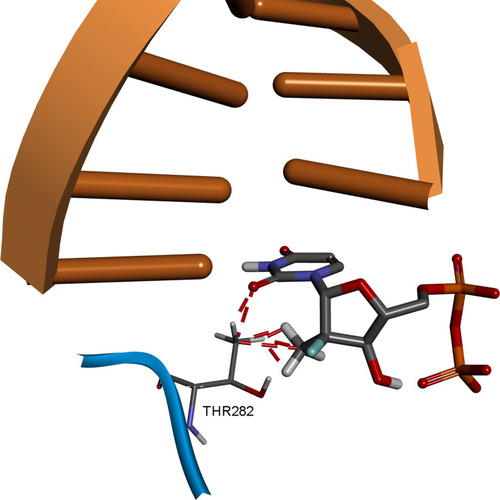
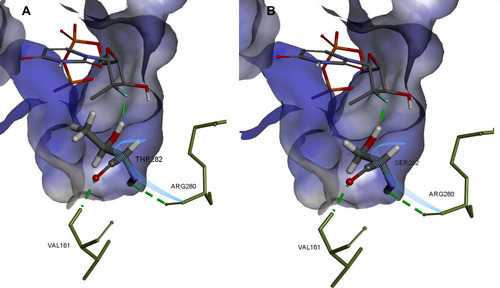
Figure 9 Comparison of SOF hydrogen bonding in HCV genotype 4a model (A) and in T282S mutant structure (B). Image prepared using BIOVIA Discovery Studio.