
Figures & data
Table 1 Patient Characteristics of the Two Groups
Table 2 Comparison of the Tested Markers in the Two Groups
Figure 1 ROC curve shows the infected nonunion predictive value of WBC, CRP, ESR, and plasma fibrinogen.
Abbreviations: WBC, white blood cell; CRP, C-reactive protein; ESR, erythrocyte sedimentation rate.
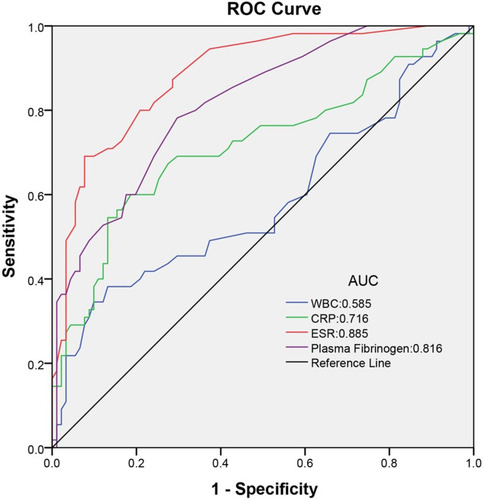
Table 3 The Diagnostic Value of Tested Markers in Patients