Figures & data
Table 1 Antimicrobial Drug Susceptibility Profiles
Figure 1 Phylogenetic relatedness of the E. coli ST648 strains. The figure represents the phylogenetic tree of four E. coli ST648 strains available as full genome sequences in Genbank as well as the strain (Genbank ID: CP048107) investigated in this study. The four resistance strains were respectively isolated from a hospital of Beijing in 2009 (Genbank ID: CP008697), a hospital of Greek in 2018 (Genbank ID: CP035318 and CP035317) and a wild bird of Germany in 2012 (Genbank ID: CP023815).
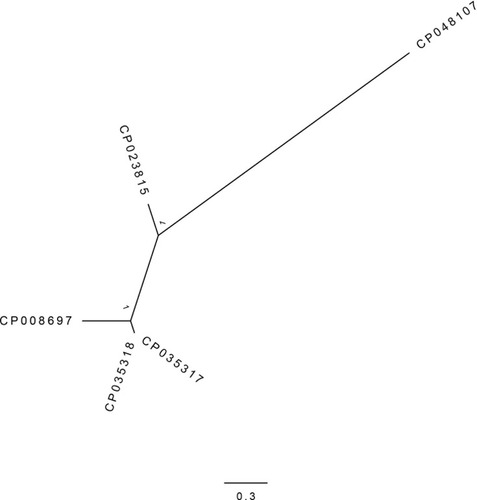
Figure 2 Sequence alignment of the pGD80-2 with the pE648CTX-M-65 generated by the Brig software.
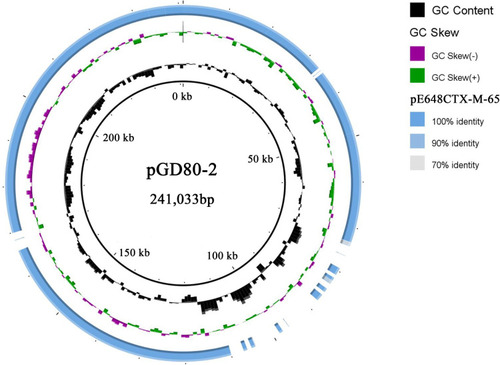
Figure 3 Organization and comparison of pE648CTX-M-65 and pGD80-2. (B) Linear sequence comparison of pE648CTX-M-65 with pGD80-2. Regions of > 99% identity are marked by light blue shading. (A) The MRR of pE648CTX-M-65. Genes are denoted by arrows and are colored based on gene function classification. Red, drug-resistance genes; green, mobile elements; violet, common genes; grey domain marked, the transposon.
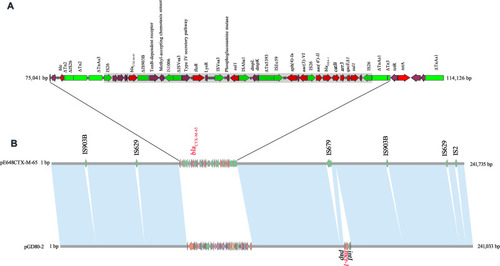
Figure 4 Sequence alignment of the pE648NDM-5 with the pNDM5_IncX3 and the pP855-NDM5 generated by the Brig software.
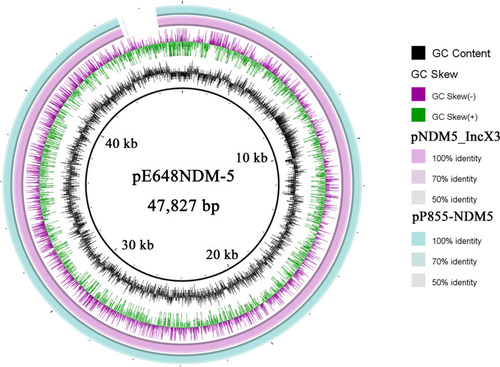
Figure 5 Sequence alignment of the pE648MCR-1 with the pMCR1_IncX4 and the pGD65-4 generated by the Brig software.
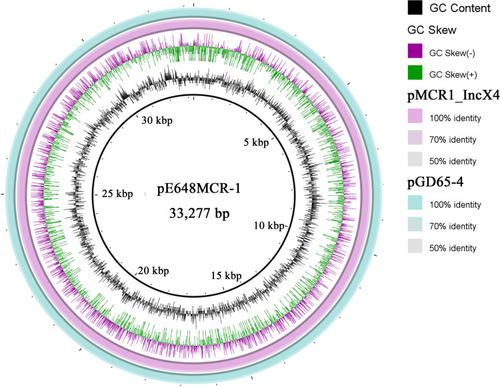
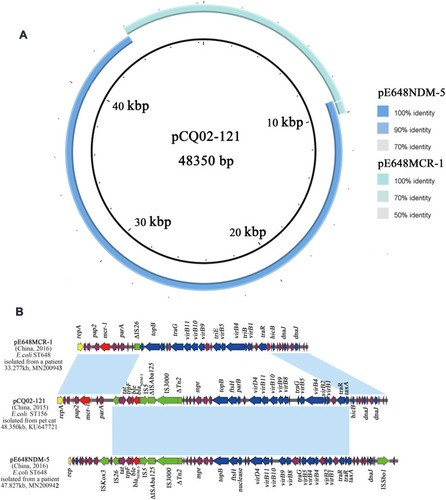
Figure 6 Sequence comparison of pE648NDM-5 and pE648MCR-1 with pCQ02-121. (A) Sequence Alignments generated by the Brig software. (B) Linear Comparison of the three plasmids with annotated genes. Genes are denoted by arrows and are colored based on gene function classification. Red, drug-resistance genes; green, mobile elements; violet, common genes. Regions of > 98% identity are marked by light blue shading.