Figures & data
Figure 1 Comparison of cross-sectional chest CT images at different time points. Before admission (Day −2), a large pleural effusion (black arrow) was seen in the right lung on two cross sections (A1 and A2); When the patient’s condition worsened (Day 10), new pleural effusion (black arrow) in the left lung and diffuse patchy shadow (white arrow) in both lungs were shown in two cross sections (B1 and B2); Before discharge (Day 15), two cross-sections of chest CT (C1 and C2) showed absorption of left pleural effusion, reduction of right pleural effusion (black arrow), and reduction of diffuse patchy shadow in both lungs (white arrow).
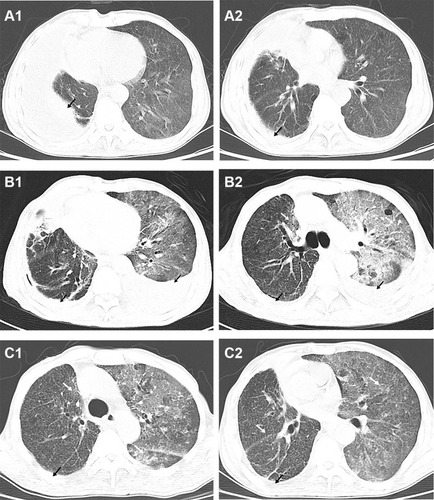
Table 1 Pleural Effusion Test Results
Figure 2 Taxonomic classification of sequencing readings read from pleural effusion. (A) Microbe sequences distribution in hydrothorax sample of right chest (B) Bacterium sequences distribution in hydrothorax sample of right chest on genus level (C) Microbe sequences distribution in hydrothorax sample of left chest (D) Bacterium sequences distribution in hydrothorax sample of left chest on genus level.
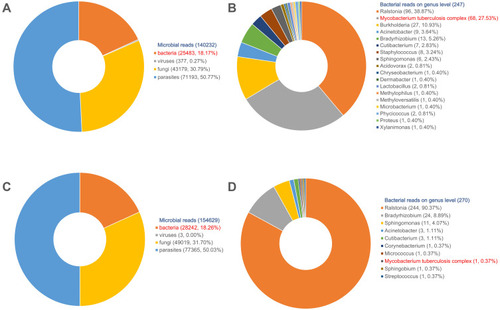
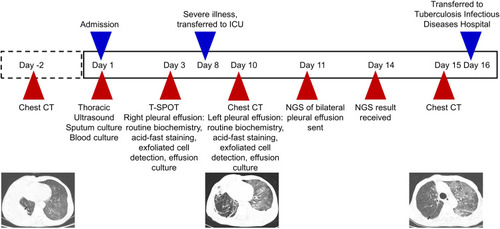
Figure 3 Patient diagnosis flow chart.