Figures & data
Figure 1 The chemical structure of selinexor (A) and pirfenidone (IS, (B)).
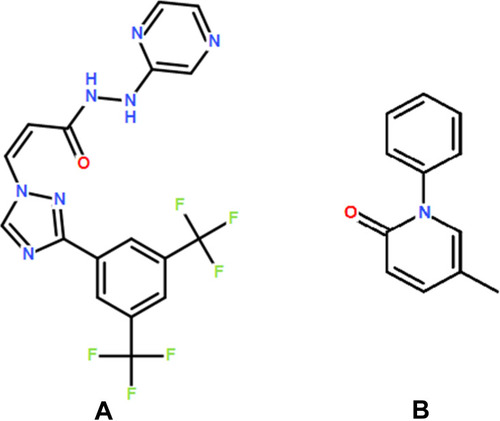
Figure 2 Continued.
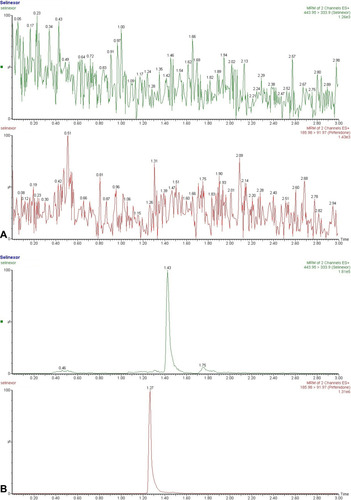
Figure 2 Representative chromatograms in positive ion mode. (A) A blank plasma sample; (B) a blank plasma sample spiked with selinexor and IS; (C) a rat plasma sample three hours after oral administration of selinexor (8 mg/kg).
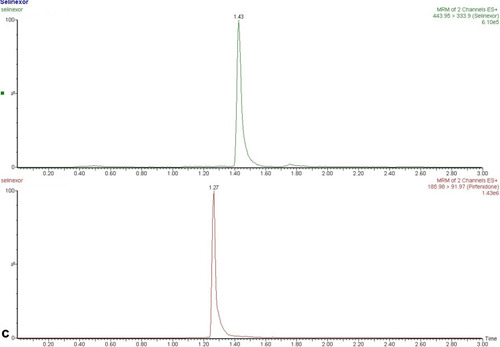
Table 1 Regression Equation, Linearity Range, Correlation Coefficients and LLOQ of Selinexor
Table 2 Precision and Accuracy of Selinexor in Rat Plasma (n=6)
Table 3 The Recoveries and ME of Selinexor and is in Rat Plasma (n=6, Mean ±SD)
Table 4 The Stability of Selinexor and is in Rat Plasma (n=6)
Table 5 The Stock Solution Stability of Selinexor and is in Rat Plasma (n=6)
Table 6 Pharmacokinetic Parameters of Selinexor After Oral Administration to 8 mg/kg Selinexor (n=6, Mean ±SD)
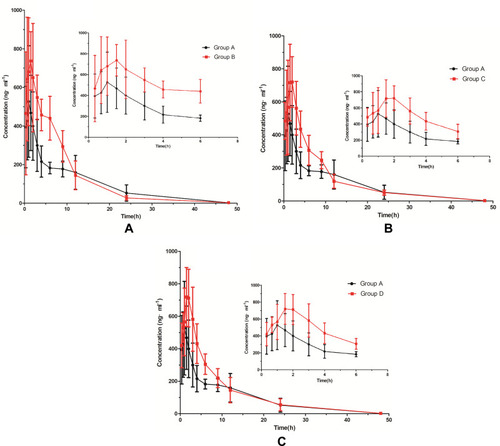
Figure 3 The mean plasma concentration-time curve of selinexor (zoomed one to six hours pharmacokinetic profile). Group A, normal saline; Group B, isavuconazole (20 mg/kg); Group C, itraconazole (20 mg/kg); and Group D, fluconazole (20 mg/kg) (n=6).