
Figures & data
Table 1 Comparison of Basic Information and Blood Tests Among the Three Groups (±s)
Figure 1 Flow cytometry results (A–C).
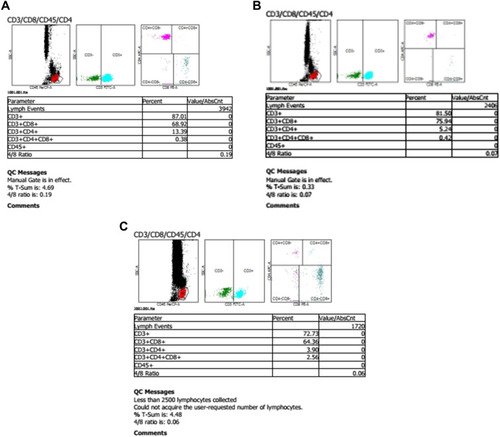
Table 2 Distribution of NK Cell Subsets in Three Groups of Patients (±s)
Table 3 Analysis of the Correlation Between T Cell and NK Cell Subset Distribution and HIV-RNA Expression