
Figures & data
Figure 1 Case identification flow chart.
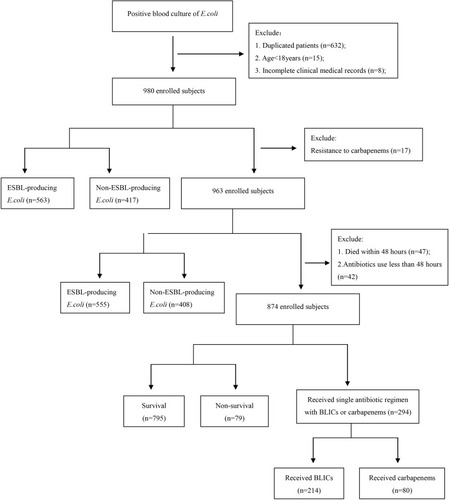
Table 1 Antibiotic Resistance of ESBL-Producing Escherichia coli versus Non-ESBL-Producing Escherichia coli
Table 2 Demographic and Clinical Characteristics of Patients with ESBL-Positive and ESBL-Negative Escherichia coli
Table 3 Analysis of Risk Factors for 30-Day Mortality in Patients with Escherichia coli Bloodstream Infections
Figure 2 Kaplan–Meier 30-day survival estimates: (A) patients (SOFA score <2) treat with carbapenem and BLICs antibiotics (p=0.008); (B) patients (SOFA score≥2) treated with carbapenem and noncarbapenem antibiotics (p=0.044).
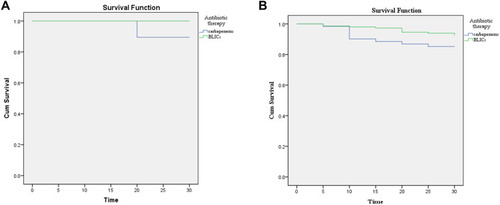
Table 4 The Patients Treated with Single Regimens in Different SOFA Score Groups