Figures & data
Figure 1 The expression of ACE2 and TMPRSS2 in tissue.
Notes: (A) The mRNA and protein expression pattern of ACE2 in HPA, GTEx and FANTOM5. (B) The mRNA and protein expression pattern of TMPRSS2 in HPA, GTEx and FANTOM5. (C) The mRNA expression pattern of ACE2 and TMPRSS2 in GSE3526. (D) The mRNA expression pattern of ACE2 and TMPRSS2 in GSE8124. (E) The mRNA expression pattern of ACE2 and TMPRSS2 in central nervous system. (F) The mRNA expression pattern in TCGA, ** = P<0.01, **** = P<0.0001, ns = P>0.05. (G) The mRNA expression pattern of TMPRSS2 in TCGA, ** = P<0.01, **** = P<0.0001, ns = P>0.05.
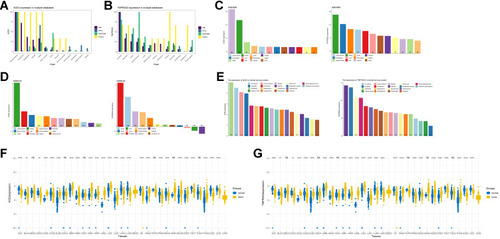
Figure 2 The panel of immunohistochemical image of ACE2 and TMPRSS2 in target organs.
Notes: (A) The panel of immunohistochemical images of ACE2 in kidney. (B) The panel of immunohistochemical images of ACE2 in testis. (C) The panel of immunohistochemical images of TMPRSS2 in kidney. (D) The panel of immunohistochemical images of TMPRSS2 in prostate.
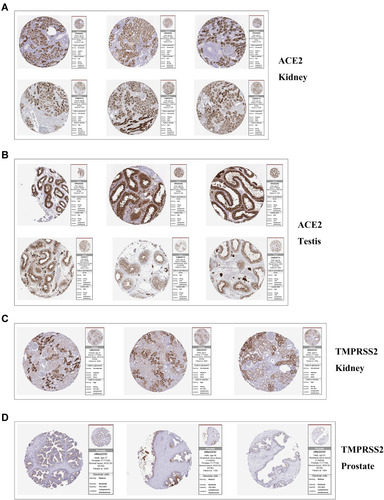
Figure 3 ACE2 and TMPRSS2 expression patterns in specific patient populations.
Notes: (A) ACE2 and TMPRSS2 expression patterns in GSE113439, * = P<0.05, ** = P<0.01, *** = P<0.001, ns = P>0.05. (B) ACE2 and TMPRSS2 expression patterns in GSE66494, * = P<0.05, ** = P<0.01, *** = P<0.001, ns = P>0.05. (C) ACE2 and TMPRSS2 expression patterns in GSE96804, * = P<0.05, ** = P<0.01, *** = P<0.001, ns = P>0.05. (D) ACE2 and TMPRSS2 expression patterns in GSE10006, * = P<0.05, ** = P<0.01, *** = P<0.001, ns = P>0.05. (E) ACE2 and TMPRSS2 expression patterns in female. (F) ACE2 and TMPRSS2 expression patterns in male.
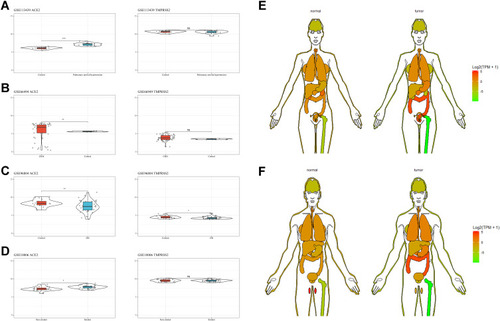
Table 1 The Brief Review of Existing Paper with Genitourinary System Impairment
Table 2 The Pairwise Distance of ACE2 in Different Species
Figure 4 Multiple sequence alignment of ACE2.
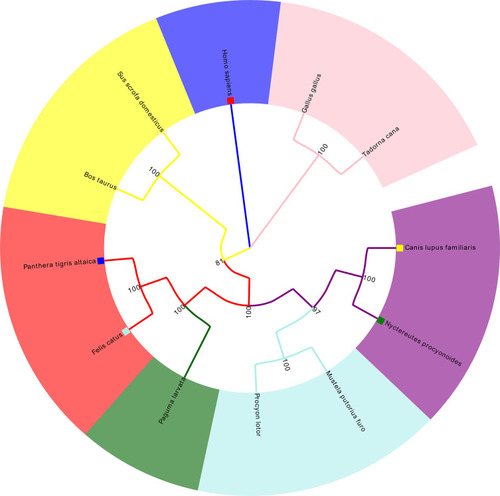
Figure 5 Cell-specific expression of ACE2 and cytokine receptors in kidney.
Notes: (A) Cell-specific expression of ACE2 from http://humphreyslab.com/SingleCell/(Healthy adult human kidney, epithelia). (B) Cell-specific expression of ACE2 from http://humphreyslab.com/SingleCell/(Healthy adult human kidney, complete). (C) Cell-specific expression of ACE2 and cytokine receptors from Human Cell Landscape Kidney2 (http://bis.zju.edu.cn/HCL/search.html). (D) Cell-specific expression of ACE2 and cytokine receptors from Human Cell Landscape Kidney3 (http://bis.zju.edu.cn/HCL/search.html). (E) Cell-specific expression of ACE2 and cytokine receptors from Human Cell Landscape Kidney4 (http://bis.zju.edu.cn/HCL/search.html).
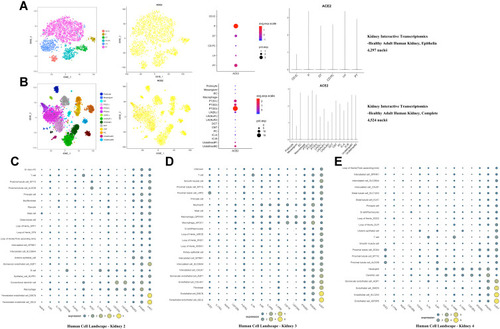
Figure 6 Cell-specific expression of ACE2 and cytokine receptors in testis.
Notes: (A) Cell-specific expression of ACE2 in GSE124263. (B) Cell-specific expression of ACE2 and cytokine receptors from Human Cell Landscape http://bis.zju.edu.cn/HCL/search.html.
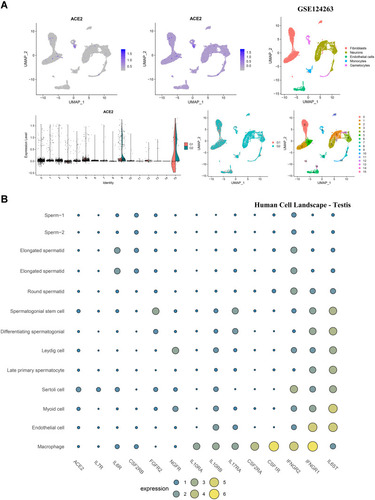
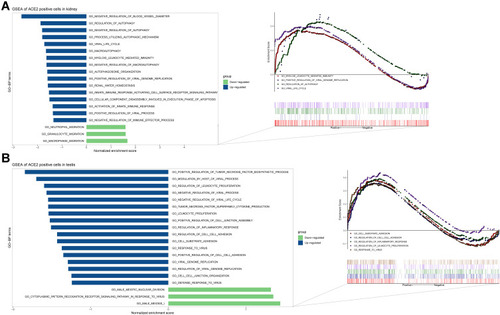
Figure 7 GSEA of ACE2-positive cells in kidney and testis.
Notes: (A) GSEA of ACE2-positive cells in kidney (kidney proximal tubule cells). (B) GSEA of ACE2-positive cells in testis (spermatogonial stem cells, Leydig cells, Sertoli cells, and myoid cells).