Figures & data
Table 1 Antibiotics Used to Test Antimicrobial Susceptibility of Five Types of Bacteria
Table 2 Frequency Distribution of Bacterial Species Recovered from Dairy Farms and Slaughterhouse
Table 3 Multidrug Resistance Patterns (MDR) of Recovered Bacterial Species (N=40) from Dairy Farms and a Beef Slaughterhouse
Figure 1 Characterization of AgNPs-H2O2 product, TEM micrographs and size distribution for silver (scale bar: 100 nm), micrographs displays AgNPs-H2O2 with sizes ranging from (30.17–67.92 nm) based on TEM images.
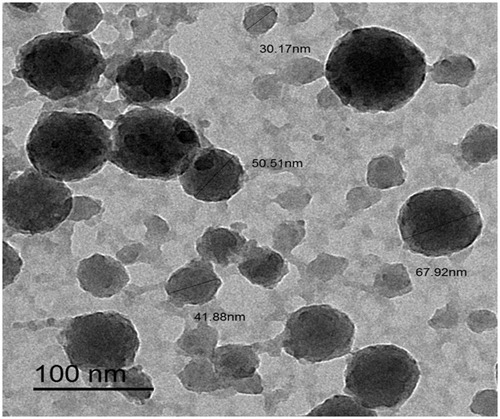
Figure 2 Zeta-potential of AgNPs-H2O2 product, −0.192 mV surface charge – good quality nanoparticles.
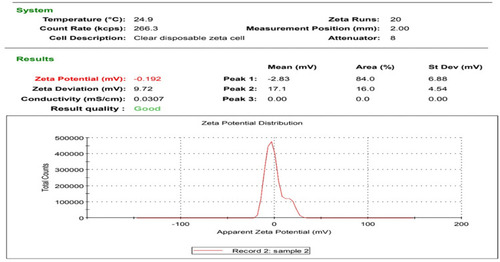
Table 4 MIC, MBC Values, and MBC/MIC Ratio of Commercial AgNPs-H2O2 Product Against MDR Bacterial Species
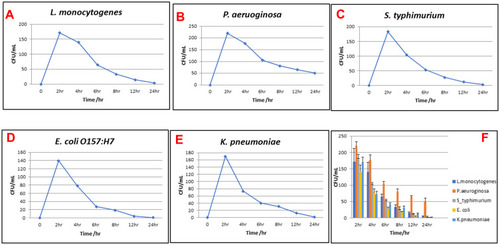
Figure 3 Time-kill assays of AgNPs-H2O2 against multidrug-resistant bacteria. (A) L. monocytogenes, (B) P. aeruginosa, (C) S. typhimurium, (D) E. coli O157:H7, (E) K. pneumoniae, and (F) comparison of time-kill assay of AgNPs-H2O2 against all tested MDR bacteria. The measurements were made at 0, 2, 4, 6, 8, 12, and 24 hours post-treatment, viability of microorganisms expressed by CFU/mL, data points represented by mean±SEM for triplicates of each experiment.