Figures & data
Figure 1 Computed tomography (CT) at the level of the maxillary sinus (A and C and E) and the ethmoid sinus (B and D and F). (A and B) The nasal septum fracture and soft tissue density in sinus cavity were observed at the onset, those were not remarkable changed just before endoscopic sinus surgery (C and D). (E and F) Follow-up CT scan after endoscopic surgery (before additional surgery) showed the removal of fractured nasal septum and the improvement of mucosal thickening.
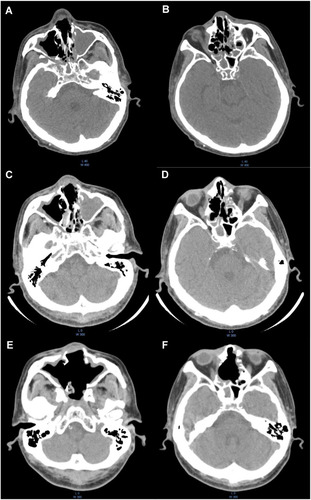
Figure 2 Endoscopic findings of progressive gangrene. (A) The destroyed nasal cavity was heavily crusted on admission. (B) Necrotic tissue on the oral palate at admission. (C) Sphenoid sinuses and (D) palate defect four months after additional necrotomy. Almost no necrotic tissue remained at either site.
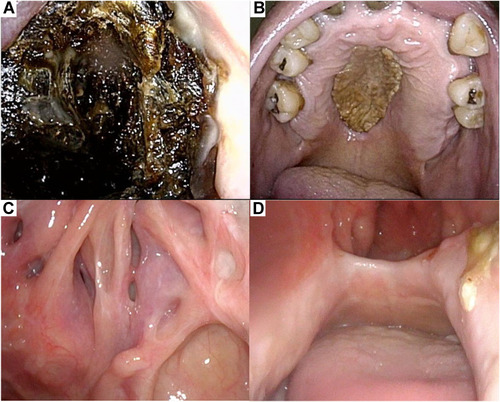
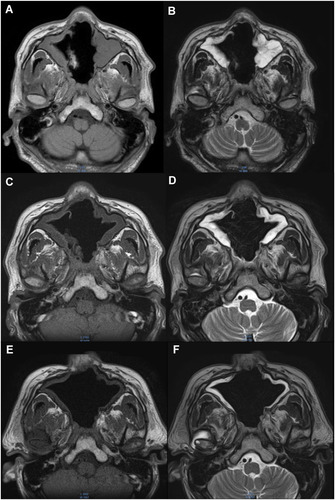
Figure 3 Magnetic resonance imaging (MRI) on admission. Horizontal views of (A and D) T1-weighted, (B and E) T2-weighted, and (C and F) FLAIR images at the level of (A–C) the maxillary sinus and (D–F) the eyeballs. The nasal septum was disrupted (A–C) and structural deformation with mucosal thickening and fluid retention were observed in the maxillary, ethmoid and sphenoid sinuses (A–F).
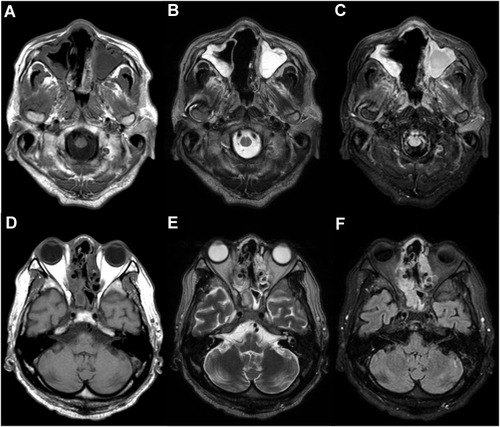
Figure 4 Histopathological findings. (A) Infiltrations of Candida species and Actinomycetes in the background of necrotic tissue of the soft palate (hematoxylin and eosin (HE) staining, × 600). (B) Infiltration of Mucor in the background of necrotic tissue of the soft palate (HE, ×400). (C–E) Low- (×100) (C) and high- (×400) (D) power magnification views of resected gangrene. Brown spores of Aspergillus niger and surrounding calcium oxalate crystals were identified in the background of necrotic tissue (E).
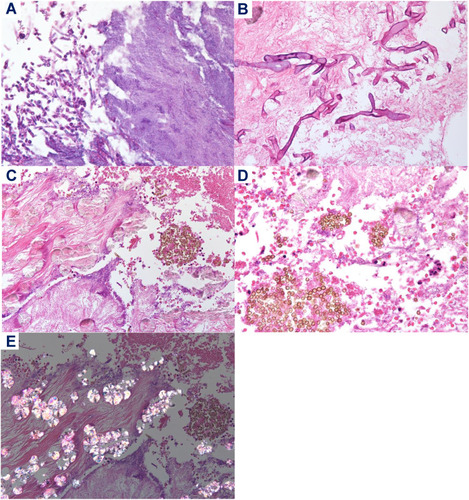
Figure 5 MRI findings along with clinical course. Horizontal views of (A and C and E) T1-weighted, and (B and D and F) T2-weighted images at the level of the maxillary sinus after endoscopic sinus surgery (A and B), before the additional operation (C and D), and five months after the additional operation (E and F).