Figures & data
Table 1 PCR Primers Used in This Study
Table 2 Susceptibility Characteristics of the Six Escherichia coli Isolates Studied
Table 3 Analysis of Mobile Colistin Resistance (mcr) Genes and TCS Regulatory Pathways in (Hetero)resistant E. coli Isolates
Figure 1 Expression levels of regulatory genes in colistin-heteroresistant isolates. *P<0.05; WT, native isolates.
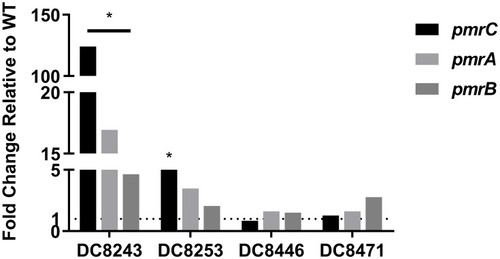
Figure 2 Mcr-1 gene expression in colistin-resistant E. coli in the absence of antibiotics and following 2 mg/L colistin +10 mg/L CCCP.
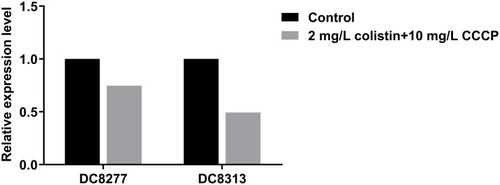
Figure 3 pmrC gene expression in colistin-heteroresistant E. coli in the absence of antibiotics and following 2 mg/L colistin +10 mg/L CCCP; WT, native isolates; HRP, heteroresistant subpopulations.
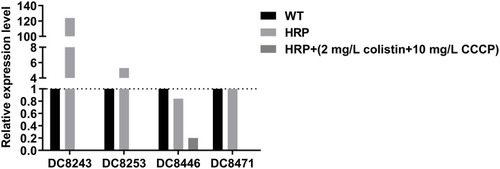
Figure 4 MALDI-TOF of E. coli with differential colistin susceptibility. (A) The MS profiles of colistin-resistant isolates. *, Lipid A modification; (B) The MS profiles of colistin-heteroresistant isolates. *Lipid A modification.
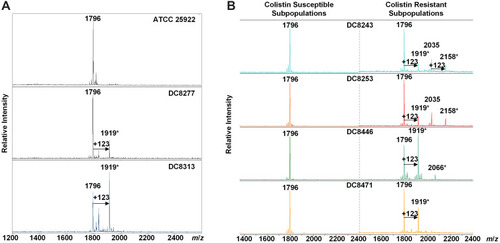
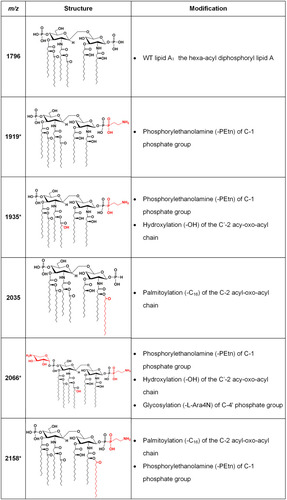
Figure 5 Lipid A structures with corresponding m/z values found in clinical isolates. Lipid A m/z values and molecular structures found in mass spectra of the E. coli clinical isolates are shown, with descriptions of the modifications responsible for the observed mass shifts. The asterisks denote ions associated with colistin resistance. The modified moieties are highlighted in red.