Figures & data
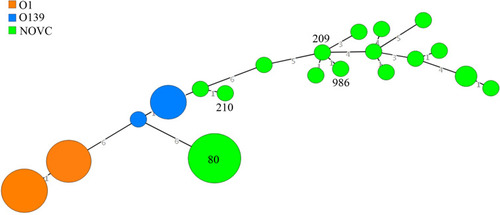
Figure 1 Clinical manifestations of the perioral area (A) and the oral mucosa tissue (B) infected due to non-O1/non-O139 V. cholerae.
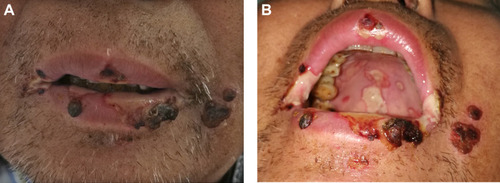
Figure 2 Minimum spanning tree analysis of NOVC isolates based on multilocus sequence typing data according to sequence type (ST). The number in the circle indicates the ST and the size of the circle corresponds the total number of isolates belonging to that ST. The number of different alleles between STs is indicated on the branches.