Figures & data
Table 1 Sequences of the Primers Used for PCR Amplification
Figure 1 The yearly distribution of the proportions of the Shigella isolates.
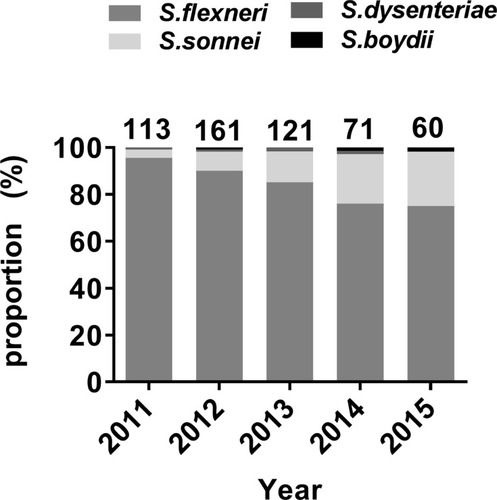
Figure 2 Age and gender distribution of Shigella isolates in China from 2011 to 2015. (A) The distribution of the proportions of Shigella isolates by age group. (B) Comparison of the proportion of S. flexneri and S. sonnei by gender group.
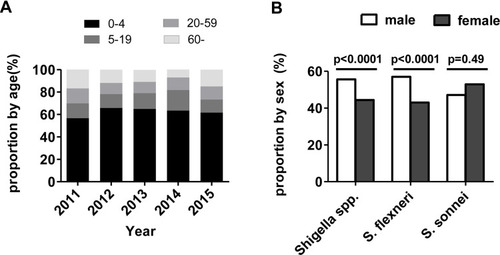
Table 2 MIC50 and MIC90 of 17 Antimicrobial Agents Against S. Flexneri and S. Sonnei
Table 3 Distribution of Virulence-Related Genes Among Shigella Isolates in Anhui, China
Figure 3 Comparison of the antimicrobial resistance rates between virulence-related gene (VRG)-positive (ial, virF, sepA, pic, sat, and set) and VRG-negative S. flexneri. (A) Comparison of the antimicrobial resistance rates between ial-positive and ial-negative S. flexneri. (B) Comparison of the antimicrobial resistance rates between virF-positive and virF-negative S. flexneri. (C) Comparison of the antimicrobial resistance rates between sepA-positive and sepA-negative S. flexneri. (D) Comparison of the antimicrobial resistance rates between pic-positive and pic-negative S. flexneri. (E) Comparison of the antimicrobial resistance rates between sat-positive and sat-negative S. flexneri. (F) Comparison of the antimicrobial resistance rates between set-positive and set-negative S. flexneri. *, P<0.05; **, P<0.001.
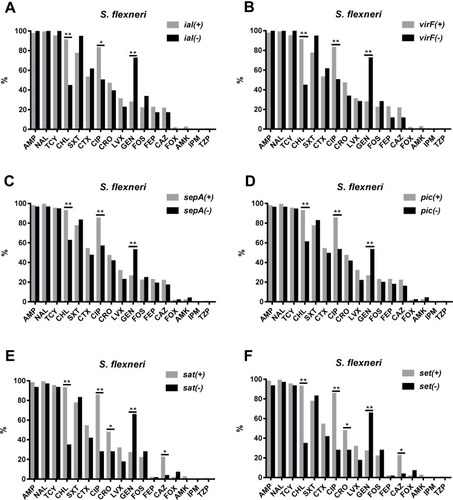
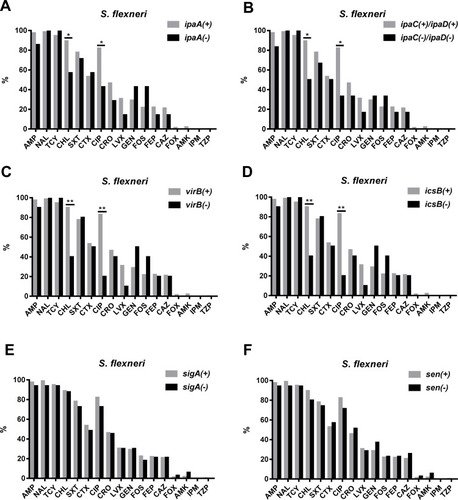
Figure 4 Comparison of the antimicrobial resistance rates between virulence-related gene (VRG)-positive (ipaA, ipaC, ipaD, virB, icsB, sigA, and sen) and VRG-negative S. flexneri. (A) Comparison of the antimicrobial resistance rates between ipaA-positive and ipaA-negative S. flexneri. (B) Comparison of the antimicrobial resistance rates between ipaC/ipaD-positive and ipaC/ipaD-negative S. flexneri. (C) Comparison of the antimicrobial resistance rates between virB-positive and virB-negative S. flexneri. (D) Comparison of the antimicrobial resistance rates between icsB-positive and icsB-negative S. flexneri. (E) Comparison of the antimicrobial resistance rates between sigA-positive and sigA-negative S. flexneri. (F) Comparison of the antimicrobial resistance rates between for sen-positive and sen-negative S. flexneri. *, P<0.05; **, P<0.001.