Figures & data
Table 1 Profile of Patients with SARS-CoV-2 RT-PCR Positive Finding
Table 2 Viral Detection in Saliva and Swab Specimens
Figure 1 SARS-CoV-2 RT-PCR cycle threshold (Ct) values for the target genes in patients with paired positive samples (i.e. both swab and saliva samples positive).
Notes: (A) Ct values for RdRp gene in the swab and saliva of patients with paired positive samples. (B) Ct values for N gene in the swab and saliva of patients with paired positive samples.
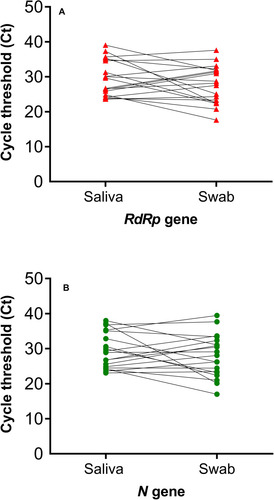
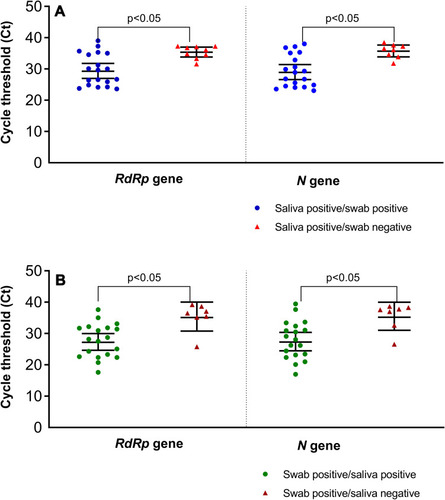
Figure 2 Comparison of RT-PCR cycle threshold (Ct) in paired positive swab and saliva versus samples with only one specimen type positive.
Notes: (A) Ct values for RdRp and N genes in saliva: saliva positive/swab positive samples had significantly lower Ct values compared to saliva only positive samples. (B) Ct values for RdRp and N genes in swab: swab positive/saliva positive samples had significantly lower Ct values compared to swab only positive samples.