Figures & data
Table 1 Distribution of abaI and abaR Genes in 80 Clinical Isolates of A. baumannii
Table 2 Antibiotic Susceptibility of A. baumannii Clinical Isolates
Figure 1 Correlation between drug resistance and carrier status of QS genes, (A) abaI and (B) abaR genes in clinical A. baumannii isolates.
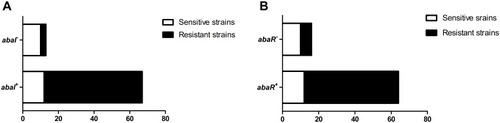
Table 3 Characteristics of Five Clinical Isolates with Apparent Surface Motility
Figure 2 Surface-related motility of A. baumannii clinical isolates. ATCC17978 was used as a positive control to show surface motility. Five clinical strains A41, A37, A38, A79, and A76 showed apparent surface motility; A5 was used as a representative clinical strain without motility. DH5α was used as a negative control.
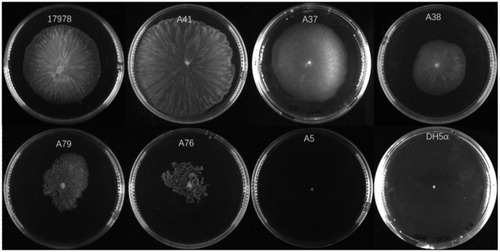
Figure 3 Correlation of invasiveness into A549 cells with carrier status of QS genes, (A) abaI and (B) abaR, and with (C) AHLs production in clinical A. baumannii isolates.*Means statistically significant and p <0.05; **Means statistically significant and p <0.01.
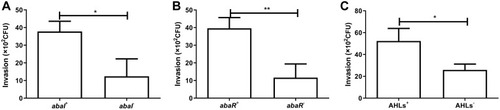
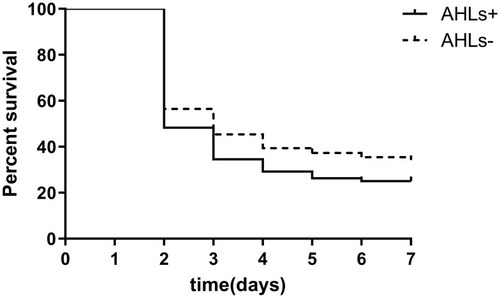
Figure 4 Kaplan–Meier survival curves of G. mellonella infected with A. baumannii clinical isolates. AHL-producing A. baumannii induced significantly greater mortality than did non-AHL-producing A. baumannii (P<0.01).