Figures & data
Table 1 Sociodemographic and Clinical Characteristics of Elderly and Non-Elderly Primary TB Patients, Shandong Province, China, 2004–2019
Table 2 Primary Drug Resistance Profiles of Mycobacterium Tuberculosis Between Elderly People and Non-Elderly People, Shandong, China, 2004–2019
Table 3 The Temporal Change Trend of Primary Drug Resistance Rate Among the Elderly TB Cases in Shandong, China, 2004–2019*
Table 4 Changes in Proportions of Different Primary Drug-Resistant Mycobacterium Tuberculosis Subgroups Among the Elderly, Shandong Province, China, 2004–2019
Figure 1 Trends for the quantity and proportions of different subgroups among the total elderly primary DR-TB cases, Shandong, China, 2004–2019*. (A) Trends for MR-TB, MDR-TB, PDR-TB among the elderly with primary TB; (B) Trends for the elderly primary DR-TB cases of different sex (male or female); (C) Trends for primary DR-TB cases with or without cavity; (D) Trends for primary DR-TB cases with or without smoking history; (E) Trends for primary DR-TB cases with or without drinking history; The proportions of each subgroups were calculated as follows: (the quantity of each subgroups/the quantity of the total elderly primary DR-TB subgroups in the same year) × 100%; The χ2 and linear regression results are shown in .
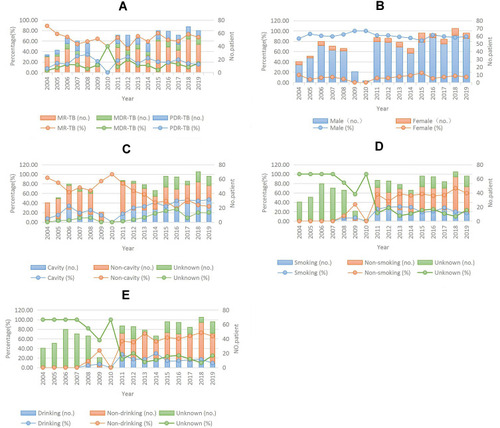
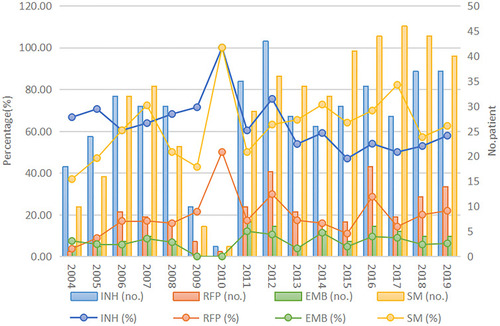
Figure 2 Overall first-line drug resistance for INH, RIF, EMB, and SM among the elderly cases of primary drug-resistant tuberculosis in Shandong, China, 2004–2019. The proportions of INH-, RIF-, EMB-, and SM-resistance were calculated as follows: (the quantity of each subgroups/the quantity of total the elderly primary DR-TB subgroups in the same year) × 100%; The χ2 and linear regression results are shown in .