Figures & data
Figure 1 Pathogenicity-associated characteristics of E. coli group ST1193 and group ST131. (A) Adhesion capability on T24 bladder epithelial cells. (B) Invasion capability on T24 bladder epithelial cells.
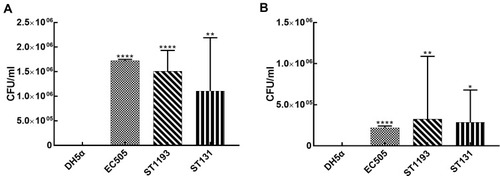
Table 1 Prevalence of Biofilm Formation Among Different E. coli Isolates
Figure 2 Macrocolonies of E. coli group ST1193 and group ST131. (A) 5-day-old macrocolonies of positive controls and negative control on macrocolony formation plates based on the presence and/or absence of curli and cellulose. (B) Curli and cellulose production distribution of E. coli ST1193 and ST131 isolates.
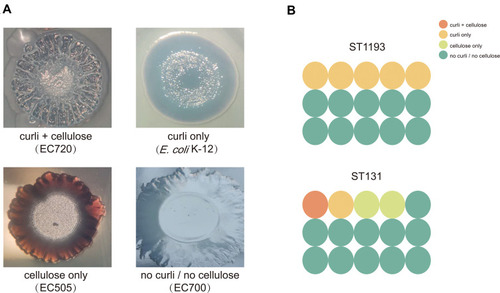
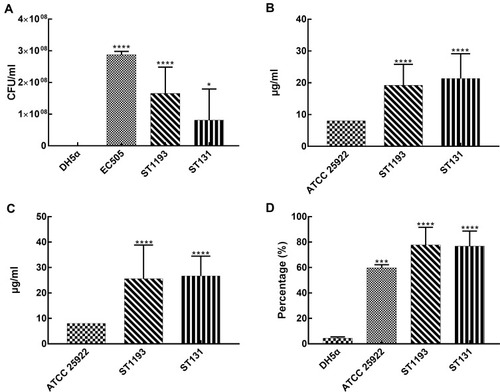
Figure 3 Survivability-associated characteristics of E. coli group ST1193 and group ST131. (A) Resistance to serum bactericidal activity against 50% human serum. (B) Resistance to hydrogen peroxide at MIC level. (C) Resistance to hydrogen peroxide at MBC level. (D) Anti-phagocytic activity to RAW264.7 cells.