
Figures & data
Table 1 Antimicrobial Susceptibility Testing Results for 451 Clinical N. Gonorrhoeae Isolates and Breakpoints Used in This Study
Figure 1 Geographic locations of the provinces where 451 N. gonorrhoeae isolates for antimicrobial susceptibility tests were collected and the number of isolates collected from each province.
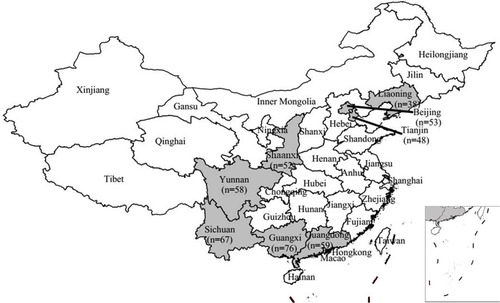
Figure 2 The percentage of N. gonorrhoeae isolates with different MICs (mg/L) for four evaluated agents, by province. (A) meropenem; (B) fosfomycin; (C) berberine hydrochloride; (D) doxycycline. The MIC50 (yellow-dotted line), MIC90 (red-dotted line) and number of isolates per province was shown in each Figure.
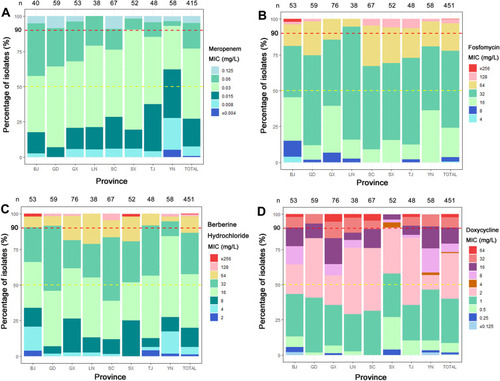
Figure 3 (A–D) Correlation between MICs of meropenem, fosfomycin, berberine hydrochloride, doxycycline and ceftriaxone. Each symbol represents one or multiple isolates, which is indicated by specific numbers and colors. The regression line was calculated using log2-transformed MIC data. r value and its corresponding P value are indicated. For MICs determined as ≤ or ≥ a specific value, this specific value was used for calculating linear regression of log2-transformed MIC data.
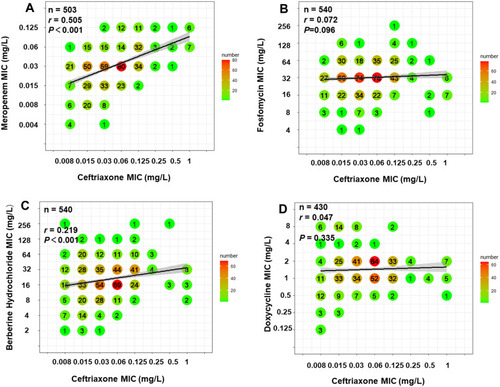
Figure 4 (A–D) Correlation between MICs of meropenem, fosfomycin, berberine hydrochloride, doxycycline and azithromycin. Each symbol represents one or multiple isolates, which is indicated by specific numbers and colors. The regression line was calculated using log2-transformed MIC data. r value and its corresponding P value are indicated. For MICs determined as ≤ or ≥ a specific value, this specific value was used for calculating linear regression of log2-transformed MIC data.
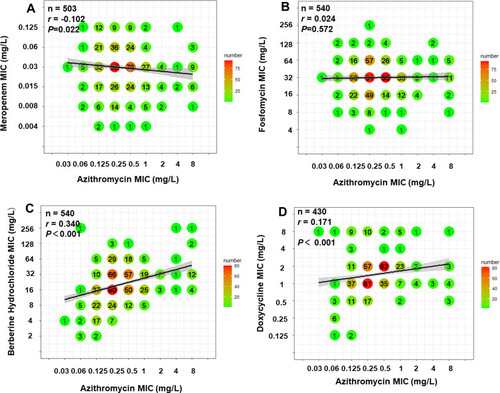
Table 2 MIC Distribution of Selected Antimicrobial Agents for 24 Isolates of N. gonorrhoeae with Decreased Susceptibility to Ceftriaxone (MIC ≥ 0.25mg/L)a
Table 3 MIC Distribution of Selected Antimicrobial Agents for 87 Isolates of N. gonorrhoeae Resistance to Azithromycin (MIC ≥ 1mg/L)a