Figures & data
Table 1 Clinical Characteristics of the Participants
Figure 1 Volcano plot of differentially expressed genes (DEGs). Red, significantly up-regulated gene; green, significantly down-regulated gene; gray, non-significantly differently expressed gene.
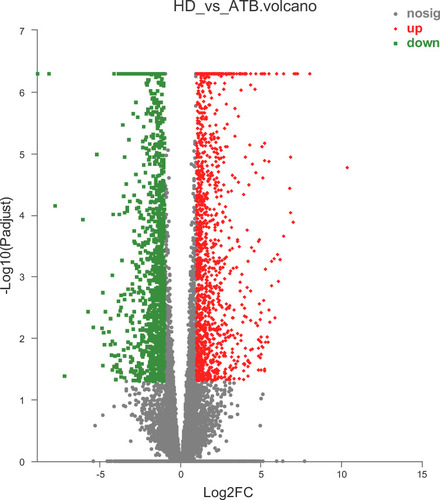
Figure 2 Bubble diagram of top 20 enriched GO terms and KEGG pathways for significantly differentially expressed genes (DEGs) between ATB and HD. (A) Top 20 ranked GO terms of up-regulated DEGs. (B) Top 20 ranked GO terms of down-regulated DEGs. (C) Top 20 pathways of up-regulated DEGs. (D) Top 20 pathways of down-regulated DEGs. Rich factor: the ratio of genes enriched in the GO term (KEGG) to the number of annotation genes, the enrichment degree was stronger with a bigger Rich factor. The size of dots indicates the number of genes in the GO term (KEGG).
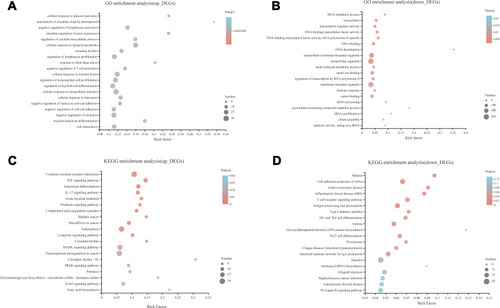
Figure 3 Top 2 modules of PPI sub-network by MCODE in Cytoscape software. (A) module 1; (B) module 2.
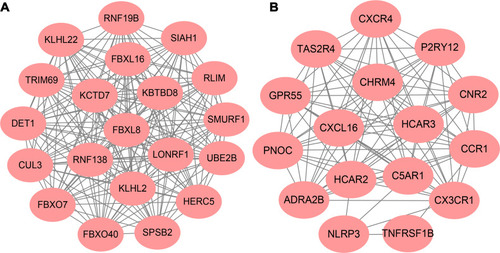
Table 2 Differentially Expressed miRNAs (DEM) in ATB Compared with HDs
Figure 4 Intersection genes between DEGs and target gene of DEMs. DEGs, significantly differentially expressed genes (mRNA) between ATB and HD; DEMs, significantly differentially expressed genes (miRNA) between ATB and HD.
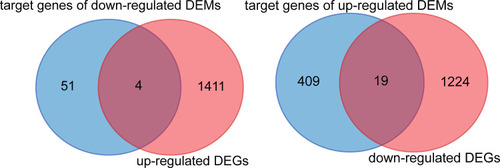
Figure 5 MiRNA-mRNA regulatory network was analyzed using Cytoscape software. Diamond-shaped represents miRNAs, and circular nodes represent target genes. Red, up-regulated miRNA or mRNA; green, down-regulated miRNA or mRNA in active tuberculosis subjects.
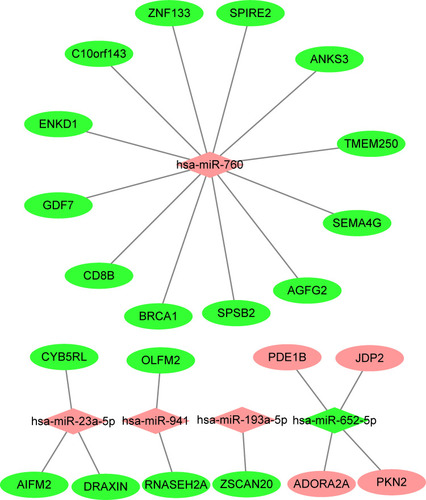
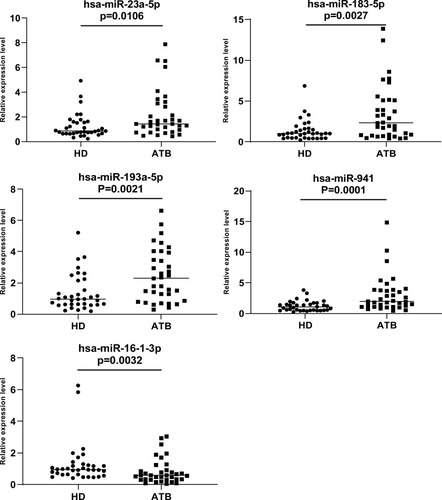
Figure 6 We analyzed the expression of five miRNAs (hsa-miR-23a-5p, hsa-miR-183-5p, hsa-miR-193a-5p and hsa-miR-941 and hsa-miR-16-1-3p) in 35 active tuberculosis patients versus 35 healthy donors. U6 was used as reference gene. 2-ΔΔCt method was used to quantify RT-qPCR data. Mann–Whitney test was used to evaluate the differences between groups. P value<0.05 was considered statistically significant.