
Figures & data
Figure 1 Hematoxylin and eosin stain (H&E) of biopsy specimens. (A) Intestinal biopsy specimen revealed acid-fast bacilli. (B) Intestinal biopsy specimen showed acid-fast bacilli (arrows). (C) Lymph node biopsy specimen revealed acid-fast bacilli. (D) Lymph node biopsy specimen showed acid-fast bacilli (arrows). (E) Bronchial biopsy specimen revealed acid-fast bacilli. (F) Bronchial biopsy specimen showed acid-fast bacilli (arrow). Original magnifications: (A) 100X; (B, D and F) 1000X; (C and E) 200X.
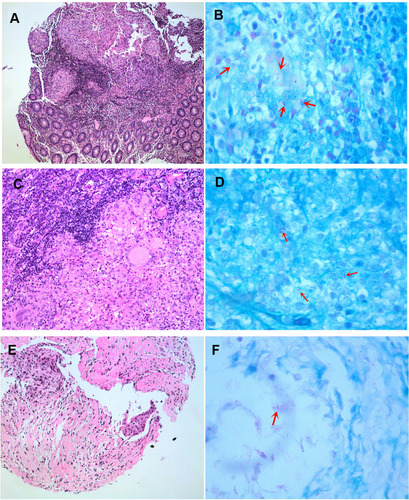
Figure 2 Computed tomography and Bronchoscopy findings. (A) Chest CT showed a nodular lesion in the right main bronchus (arrow). (B) Abdominal CT showed a mass in the right lower abdomen (arrow). (C) Bronchoscopy showed nodules in the right bronchus (arrow). (D) The nodule in the right bronchus was smaller after five months of treatment (arrow).
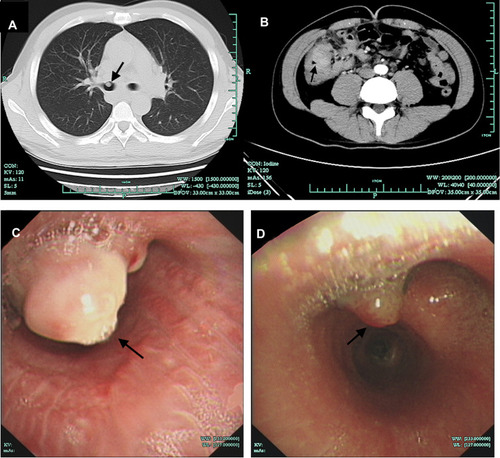
Figure 3 Identification of TYK2 compound heterozygous mutation. (A) Validation by Sanger sequencing of theTYK2 mutations in the patient and his parents. (B) Pedigree of a family in our case. Squares and circles indicate males and females, respectively. Darkened symbols represent the affected individuals. The proband is indicated by an arrow. W, wild-type; M1, c.3083A>G (p.N1028S); M2, c.2590C>T (p. R864C).
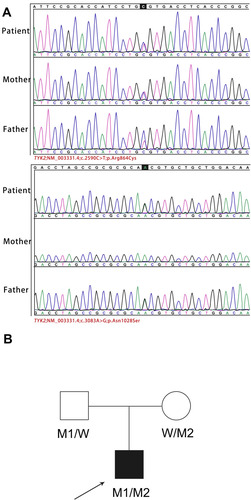
Table 1 Summary of Demographic and Clinical Characteristics