Figures & data
Table 1 Susceptibility of Bacterial Strains to Four Antibiotics in Disc Diffusion Assays
Figure 1 (A) Changes in the body weight of mice during antibiotic treatment. D1: before treatment. D4, D8, and D60: 4, 8, and 60 days after treatment. Microbial diversity measured by the Chao1 index (B) and Shannon index (C) was altered by antibiotic treatment across the treatment groups. *P < 0.05, **P < 0.01, ***P < 0.001 vs the control group.
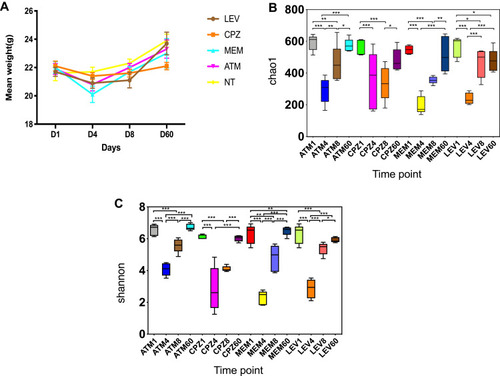
Figure 2 Serum cytokine expression in antibiotic exposed mice and a control group. (A) IL-1β, (B) IL-6, (C) IL-12 (p70), (D) IL-13, (E) IL-17, (F) IFN-γ, (G) TNF-α, (H) IL-10, (I) GM-CSF. *P < 0.05, **P < 0.01, ***P < 0.001 vs the control group.
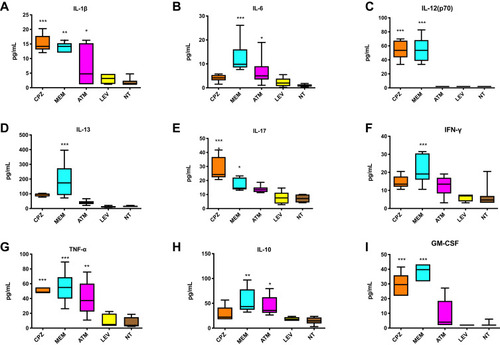
Figure 3 Analysis of microbial communities by principal coordinate analysis (PCoA) at different time points after antibiotic treatment. (A) ATM, (B) CPZ, (C) MEM, (D) LEV. Antibiotics disrupted the microbial community composition. Red dots, before treatment; green dots, immediately after treatment; blue and cyan dots, 8 and 60 days after cessation of treatment, respectively.
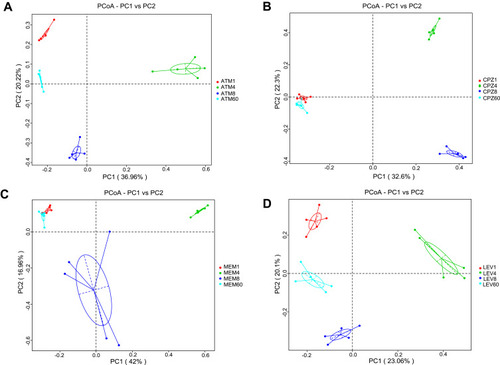
Figure 4 Changes in bacterial community composition by antibiotic treatment in mice at the phylum (A), class (B), order (C), family (D), and genus (E) levels. Antibiotics disrupted the gut microbial community and differentially affected community composition.
Abbreviations: ATM, aztreonam; CPZ, cefoperazone/sulbactam; MEM, meropenem; LEV, levofloxacin.
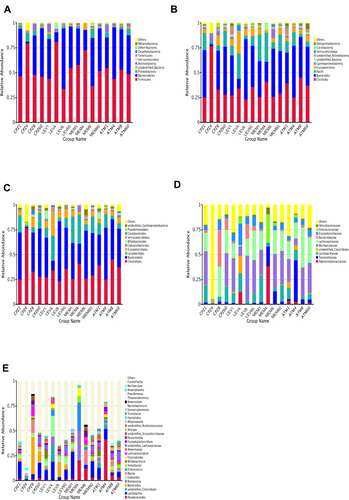
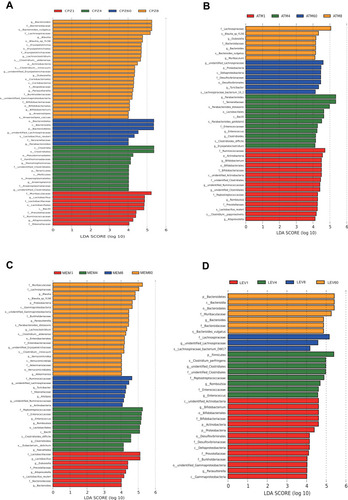
Figure 5 Time-dependent changes in the abundance of microbial taxa by antibiotic treatment according to linear discriminant analysis effect size analysis. (A) CPZ, (B) ATM, (C) MEM, (D) LEV. The length indicates the effect size associated with a taxon. Only taxa with an effect size >4 are shown. Each color corresponds to a sampling time.