Figures & data
Table 1 Malaria Incidence and Death Rate from 2010 to 2017 in Bale Zone, Southeast Ethiopia
Figure 1 Trends of annual incidence of malaria from 2010 to 2017 in Bale zone, Southeast Ethiopia.
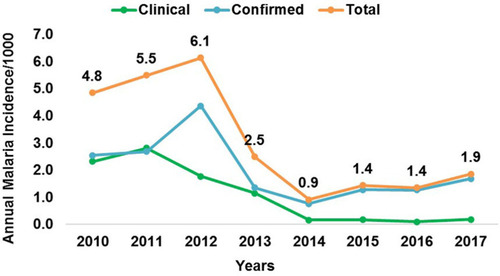
Figure 2 Trends of malaria cases by plasmodium parasite from 2010 to 2017 in Bale zone, Southeast Ethiopia.
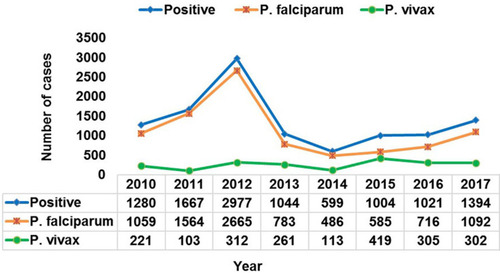
Figure 3 Trends of test positivity rate of confirmed malaria cases from 2010 to 2017 in Bale zone, Southeast Ethiopia.
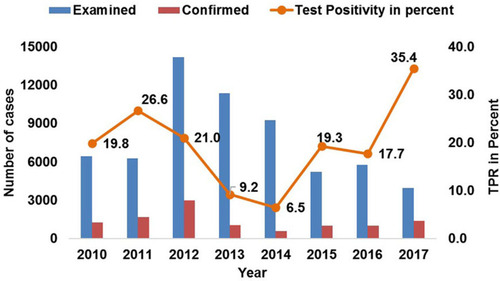
Figure 4 Mean annual incidence of malaria by Woredas/districts in Bale zone from 2010 to 2017, Southeast Ethiopia.
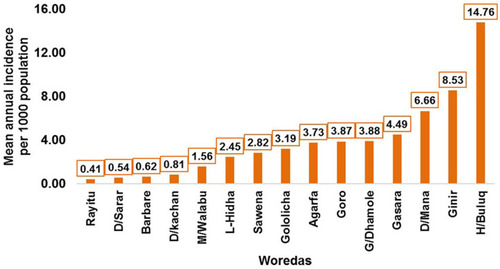
Table 2 Distribution of Malaria Cases and Incidence Rate by Gender and Age from 2010 to 2017 in Bale Zone, Southeast Ethiopia
Figure 5 Annual incidence of malaria by age group from 2010 to 2017 in Bale zone, Southeast Ethiopia.
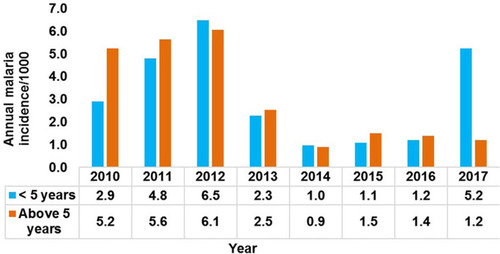
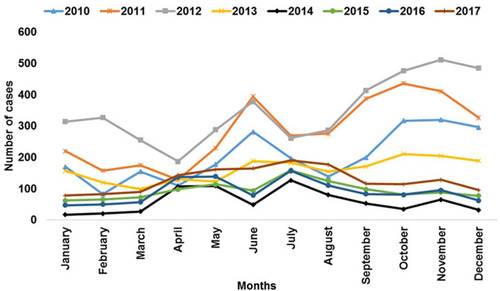
Figure 6 Seasonal distribution of malaria from 2010 to 2017 in Bale zone, Southeast Ethiopia.