Figures & data
Table 1 MIC Values of Cordycepin and Fluconazole
Figure 1 Growth curves of C. albicans in the absence or presence cordycepin.
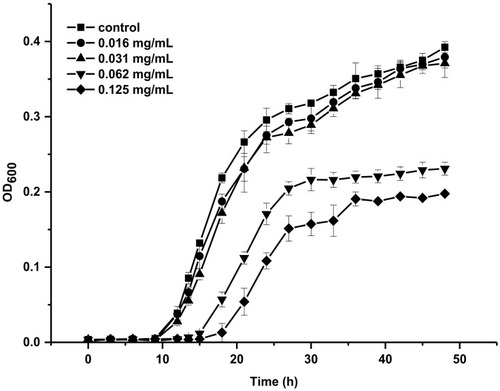
Figure 2 Effects of cordycepin on biofilms of C. albicans. (A) Inhibitory effects on biofilm formation; (B) Eradicating effects on mature biofilms. Error bars represent the standard deviations, and different letters represent statistical differences among bars (n = 3, P < 0.05).
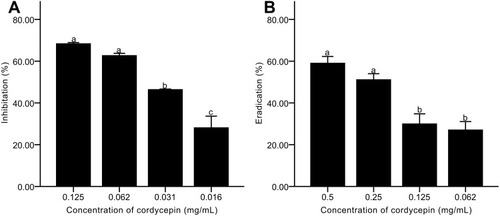
Figure 3 CLSM images of C. albicans biofilm treated with different concentrations of cordycepin. (A), (C) and (E) show the effects of 0, 0.031, and 0.125 mg/mL of cordycepin on the formation of biofilms and live/dead cells ratio. (B), (D) and (F) show the fluorescence intensities of live (green)/dead (red) cells in biofilms treated with 0, 0.031, and 0.125 mg/mL of cordycepin, respectively. Viable cells appear green due to FDA staining, and cells with damaged membranes appear red due to PI staining.
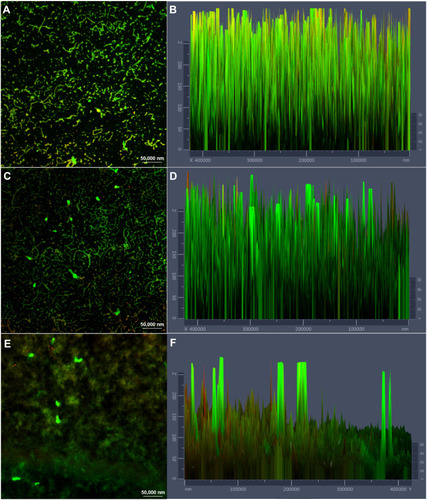
Figure 4 Changes of mature biofilms and live/dead cells before and after cordycepin treatment. (A), (C) and (E) show the effects of 0, 0.125, and 0.5 mg/mL of cordycepin on the eradication of mature biofilms and live/dead cells. (B), (D) and (F) show the fluorescence intensities of live (green)/dead (red) cells in biofilms treated with 0, 0.125, and 0.5 mg/mL of cordycepin, respectively. Viable cells appear green due to FDA staining, and cells with damaged membranes appear red due to PI staining.
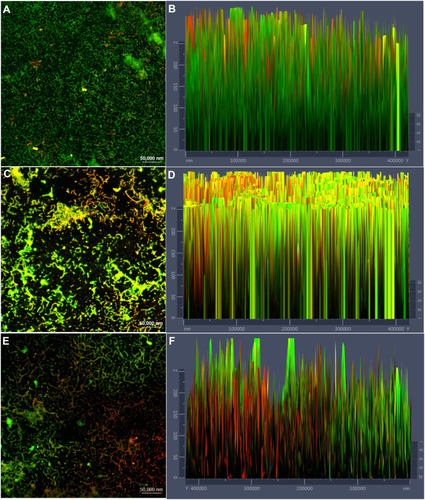
Figure 5 Effects of cordycepin on the metabolic activity of C. albicans biofilm. (A) Effects on biofilm formation; (B) Effects on mature biofilms. Error bars represent the standard deviations, and different letters represent statistical differences among bars (n = 3, P < 0.05).
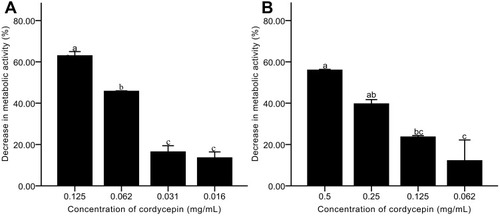
Figure 6 Effects of cordycepin on EPS secretion of C. albicans biofilm. (A) Effects on EPS secretion in biofilm formation; (B) Effects on EPS secretion in mature biofilms. Error bars represent the standard deviations, and different letters represent statistical differences among bars (n =3, P < 0.05).
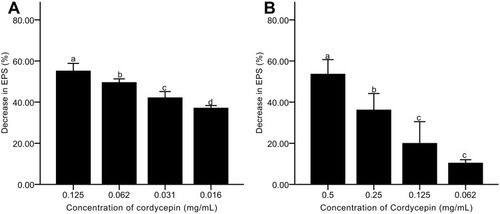
Figure 7 Distribution of polysaccharides and dead cells in cordycepin-treated biofilms. (A), (C) and (E) show the distribution of EPS (green) and dead cells (red) in biofilms treated with 0, 0.031, and 0.125 mg/mL of cordycepin. (B), (D) and (F) show the distribution of EPS (green) and dead cells (red) in mature biofilms treated with 0, 0.125, and 0.5 mg/mL of cordycepin.
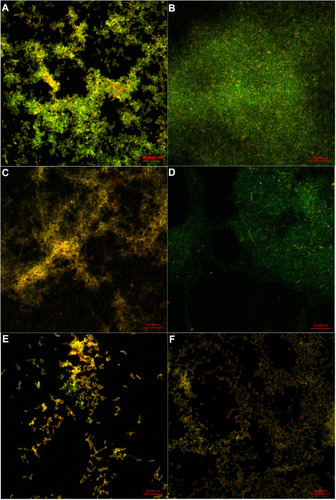
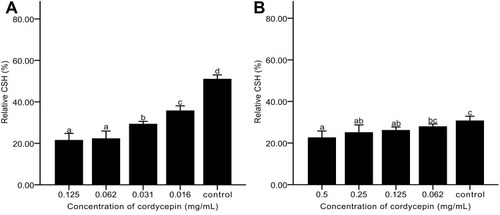
Figure 8 Effects of cordycepin on CSH of C. albicans biofilm. (A) Addition of cordycepin before biofilm formation; (B) Addition of cordycepin after biofilm formation. Error bars represent the standard deviations, and different letters represent statistical differences among bars (n = 3, P < 0.05).