
Figures & data
Figure 1 Anti-biofilm activity. Effect of different concentrations (0.625, 0.3125 and 0.156 mg/mL) of star anise extract (SA) on A. baumannii AB5057 and MRSA USA300 biofilm formation. Results are expressed as mean biofilm inhibition % ± standard error. The biofilm inhibition % was calculated using the following equation: .
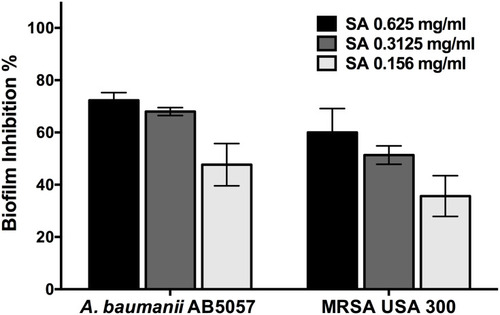
Figure 2 Biofilm detachment activity. Effect of different concentrations (0.625, 0.3125 and 0.156 mg/mL) of star anise extract (SA) on previously established A. baumannii AB5057 and MRSA USA300 biofilm. Results are expressed as mean detachment % ± standard error. The biofilm detachment % was calculated using the following equation:
*Indicates that the difference is significant at p < 0.001 (two-way ANOVA, Tukey’s post-test).
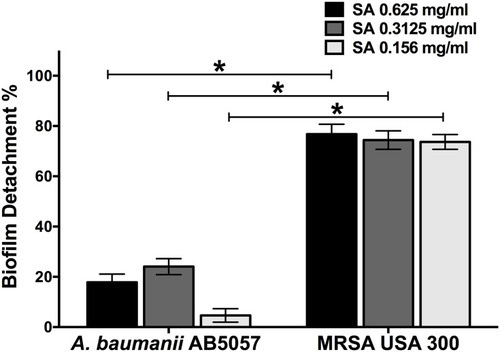
Figure 3 Efficacy of star anise extract in in vivo murine model of MRSA skin infection. Eighteen female BALB/C mice were divided into three groups (n=6). Two groups were treated topically with either star anise extract (100mg/mL) or vehicle (25%v/v DMSO in water). The third group did not receive any treatment and was used as the negative control. (A) Photo image of the efficacy of star anise extract on MRSA skin infection in the posterior upper backs of mice at the end of the experiment. (B) Efficacy of star anise extract on the bacterial load in murine model MRSA skin infection. Results are expressed as mean ± standard error. The dotted line represents the limit of detection of the viable count (log10 of 50 CFU = 1.7). *Indicates that the difference is significant at p < 0.001 (one-way ANOVA, Tukey’s post-test).
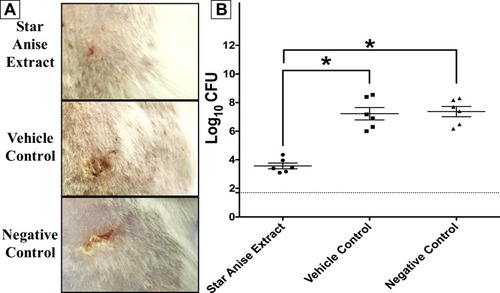
Table 1 Metabolites Identified from the Star Anise Extract After UPLC/MS Analysis
Figure 4 Base peak chromatograms (BPC) and extracted ion chromatograms (EIC) of the peak at m/z representing eugenol glucoside from star anise extract measured in positive (A) and negative (B) ionization mode. Full MS and MS/MS spectra are shown.
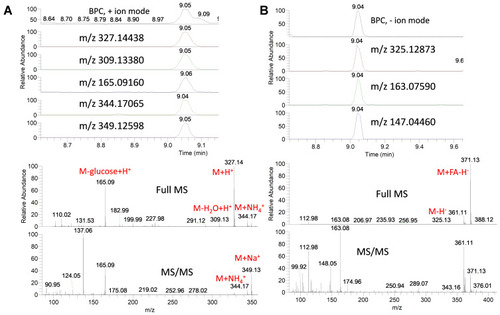
Figure 5 Base peak chromatograms (BPC) and extracted ion chromatograms (EIC) of the peak at m/z representing eugenol rutinoside from star anise extract measured in positive (A) and negative (B) ionization mode. Full MS and MS/MS spectra are shown.
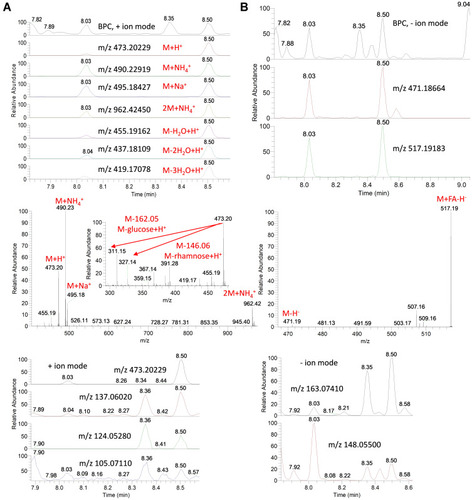
Figure 6 Base peak chromatograms (BPC) and extracted ion chromatograms (EIC) of the peak at m/z representing eugenol-arabinofuranosyl-glucopyranoside from star anise extract measured in positive (A) and negative (B) ionization modes. MS spectra are shown.
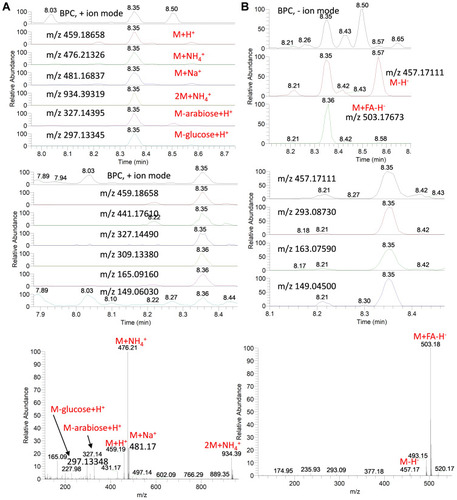
Table 2 Phenolic Content and Antioxidant Potential of Star Anise Extract