
Figures & data
Table 1 Socio-Demographic Characteristics of Patients Whose Samples Were Included (N=5328)
Table 2 Bacterial Isolates from Clinical Samples (N=5328)
Table 3 Bacteriological Isolates by Socio-Demographics and Hospital Departments (Place of Specimen Collection)
Figure 1 A pie chart showing the types of laboratory samples for culture and drug susceptibility tests.
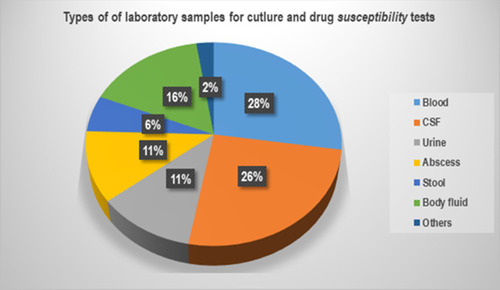
Figure 2 Culture positivity of common samples and isolates at the University of Gondar comprehensive specialized hospital.
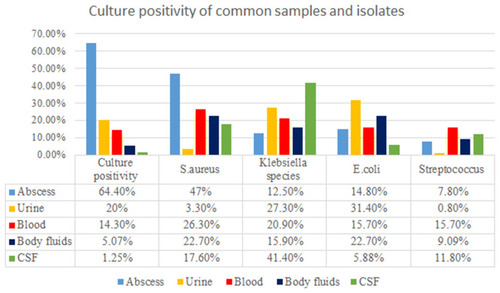
Figure 3 Graph showing the bacterial isolates by hospital departments.
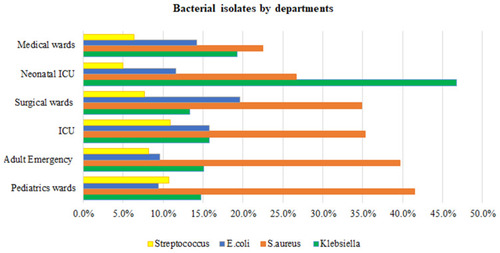
Table 4 Drug Susceptibility Test Results of Bacteriological Isolates at the University of Gondar Comprehensive Specialized Hospital
Table 5 Drug Susceptibility Test Results of Bacteriological Isolates at the University of Gondar Comprehensive Specialized Hospital (Continued)
Table 6 Drug Susceptibility Test Results of Bacteriological Isolates at the University of Gondar Comprehensive Specialized Hospital for Selected Antibiotics