Figures & data
Table 1 Constituent Ratios of the Isolated MDRB (%)
Table 2 Description of Baseline Data of Subjects
Table 3 Single-Factor Logistic Analysis of Risk Factors for Infection in Patients with DF
Table 4 Multivariate Logistic Analysis of Risk Factors for Infection in Patients with DF
Figure 1 The nomogram model for predicting the risk of MDRB infection in patients with DF. **P<0.01.
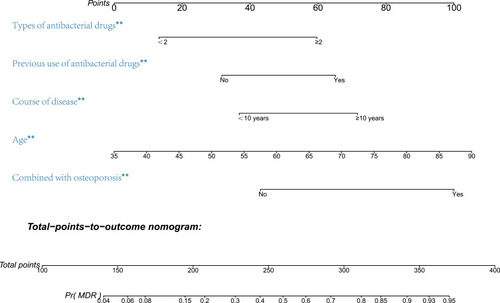
Figure 2 Application example of a nomogram for predicting the risk of MDRB infection in patients with DF. **P<0.01.
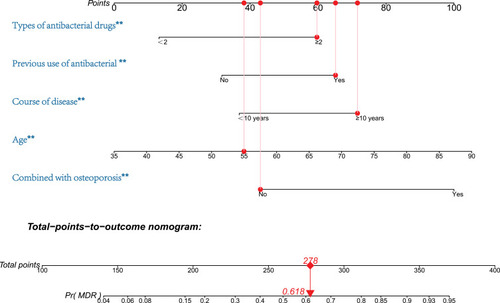
Figure 3 DCA curve analysis of nomogram model.
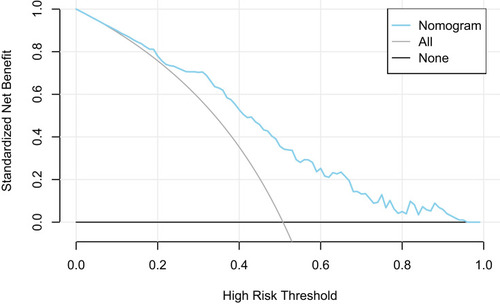
Figure 4 ROC curve analysis of different indicators.
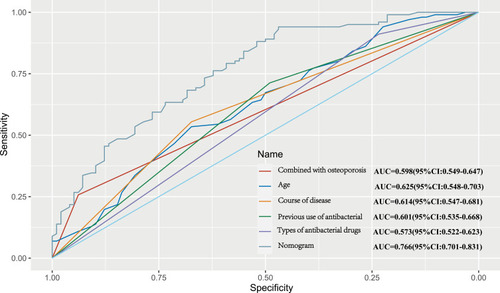
Figure 5 ROC curve analysis of the nomogram model after internal verification.
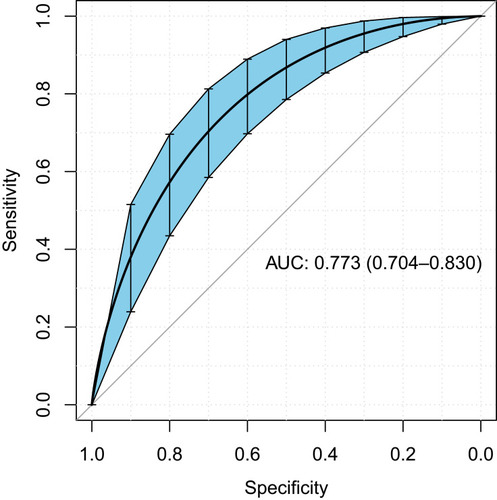
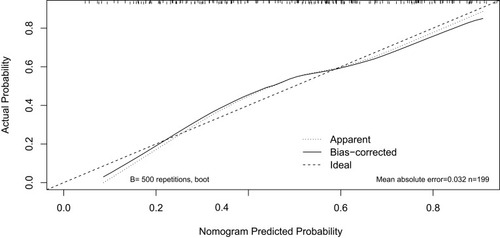
Figure 6 Calibration curve analysis of nomogram model after internal verification.