Figures & data
Box 1 Definition of Drug-Resistant Categories Based on Phenotypic DST Profiles
Table 1 Demographic and Clinical Data, Phenotype and Mutations Associated with Anti-TB Drug Resistance of the 37 Studied Isolates
Figure 1 Mycobacterium tuberculosis isolate collection and analytic methods.
Abbreviations: Am, amikacin; Cm, capreomycin; FLD, first-line drugs; FQ, fluoroquinolones; Km, kanamycin; M.tb, Mycobacterium tuberculosis; MDR, multidrug-resistant; Ofx, ofloxacin; SLID, second-line injectable drugs; TB, tuberculosis.
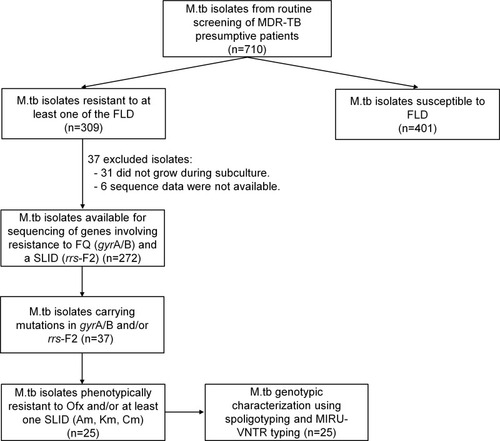
Table 2 Mutation Patterns in Genes Involved in Resistance to First- and Second-Line Drugs
Table 3 Proportion of Resistance Phenotypes Among Beijing and Non-Beijing Genotypes
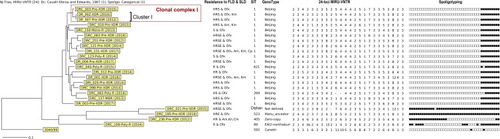
Figure 2 Phylogenetic analysis of spoligotyping and 24 loci MIRU-VNTR results of 23 Mycobacterium tuberculosis isolates resistant to SLD.
Abbreviations: Am, amikacin; Cm, capreomycin; Canetti: Mycobacterium canetti used as Outgroup; E, ethambutol; FLD, first-line drugs; H, isoniazid; Km, kanamycin; Ofx, ofloxacin; R, rifampicin; S, streptomycin; SLD, second-line drugs.