
Figures & data
Table 1 Knowledge of Antibiotics, Their Uses, and Antibiotic Resistance in Biology-Background (n=92) and Non-Biology (n=113) University Students
Table 2 Levels of Knowledge About Antibiotics, Their Uses, and Antibiotic Resistance
Figure 1 Combined knowledge scores on antibiotic uses and antibiotic resistance.
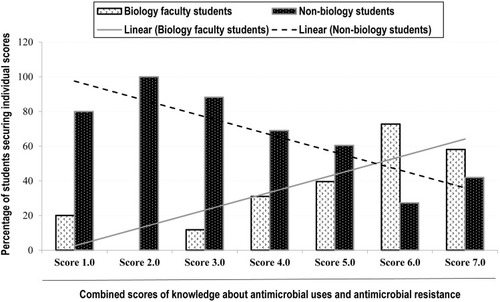
Table 3 Predictors of Knowledge About Antibiotics, Their Uses, and Antibiotic Resistance Based on Multivariate Regression Analysis
Table 4 Attitudes and Beliefs of Antibiotic Selections and Uses in Biology-Background (n=92) and Non-Biology (n=113) University Students
Table 5 Frequencies of Students Based on Their Everyday Practice of Taking Antibiotic
Figure 2 Reasons for not completing the course of prescribed antibiotics.
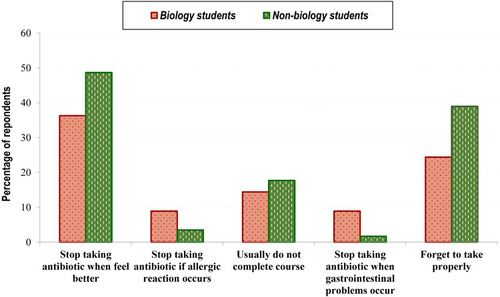
Figure 3a Continue.
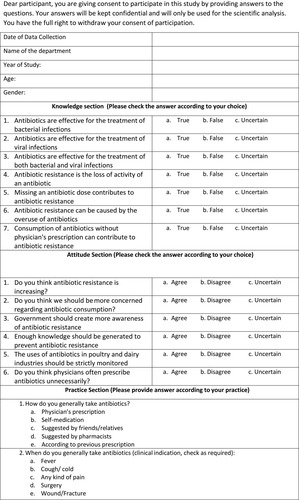
Figure 3b Questionnaire knowledge, attitude and practice about antibiotic use and antibiotic resistance among students of a public university of Bangladesh.
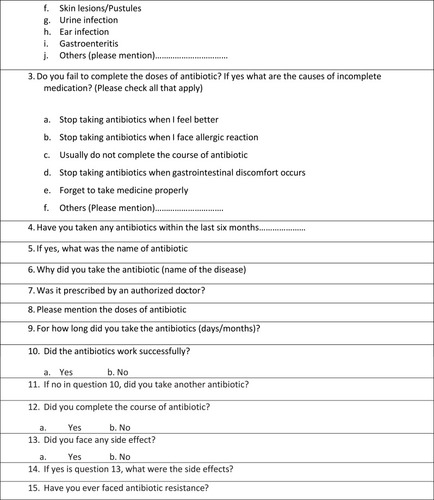
Table 6 Predictors of Self-Medication with Antibiotics Based on Multivariate Regression Analysis