Figures & data
Figure 1 Dendrogram of XbaI-digested genomic DNA of 40 KPC-Kp isolates. Five different clusters were identified based on 85% similarity of PFGE profiles. An asterisk (*) indicates that the blaKPC-2 plasmid in the strain was transferable by conjugation.
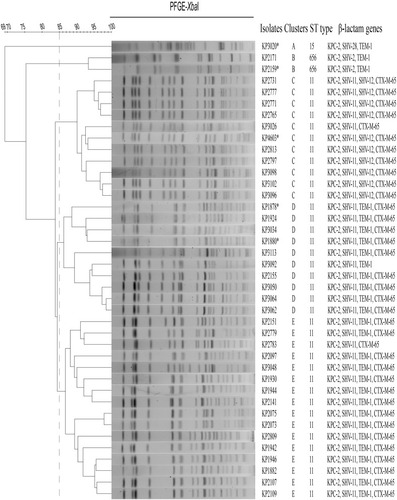
Table 1 Antimicrobial Susceptibility Testing Results of Carbapenemase-Producing Klebsiella pneumoniae Isolates from 2015 to 2017 (mg/L)
Table 2 Resistance Genes and Carbapenem MIC Levels (mg/L) of Wild Strains and Transconjugants
Figure 2 Circular map of the plasmid pKPC3020-124 and comparative genomics analysis with its humongous plasmids. Counting from the center toward outside: (1) the scale in bp. (2) GC skew (G-C/G+C), with a positive GC skew toward the outside and a negative GC skew toward the inside. (3) GC content, with an average of 50%, whereby a G+C content of more than 50% is shown toward the outside, otherwise, inward. (4) Functional regions of multidrug resistance, conjugation, maintenance and unknown function. (5) Genes encoded in the leading strand (outwards) or the lagging strand (inwards). The plasmid pKPC3020-124 (CP061355) was used as the reference sequence and was compared to the sequences of (6) pBK34397 (KU295132.1), (7) p628-KPC (KP987218.1), (8) pKPHS2 (CP003224.1) and (9) pS1-KPC2 (MN615880.1). Genes with different functions are shown in different colors: red, antibiotic resistance; blue, mobile genetic elements; orange, transfer conjugation; light green, plasmid stability and replication; brown, heavy metal resistance; pink, toxin-antitoxin system; yellow, DNA metabolism; and gray, hypothetical proteins/genes with unknown functions.
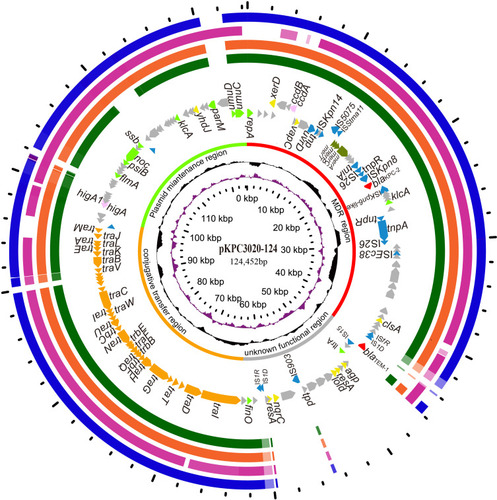
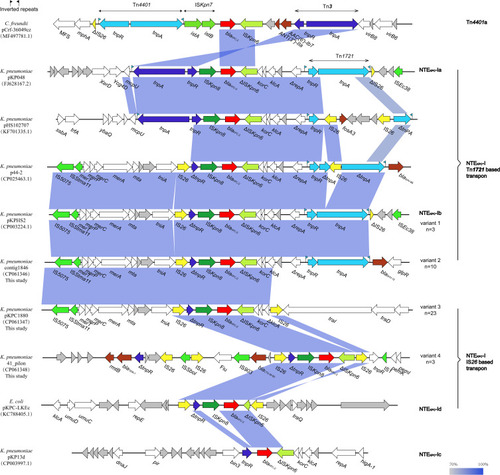
Figure 3 Comparison of the blaKPC-2-encoding regions between 10 representative plasmid sequences. The arrows represent the direction of transcription. ORFs are depicted by arrows and are colored based on predicted gene function. Light blue shading denotes homology of regions in each adjacent plasmid. The blaKPC-2 genes are shown in red.