
Figures & data
Table 1 Primers Used in This StudyCitation5
Table 2 Antimicrobial Resistance Pattern of A. baumannii Against Different Antibiotics (N=52)
Figure 1 Amplification of aaaC1 gene in MDR A. baumannii by PCR; Lane (L) shows 100-bp molecular size ladder, lane (P) is the positive control, lanes 1,5,6,7,9,10,11 are the positive samples carrying aaaC1 gene (456 bp). Lanes 2,3,4,8 are negative samples. Lane (12) is the negative control.
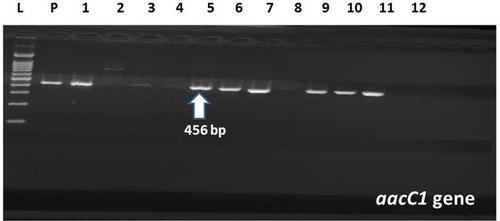
Figure 2 Amplification of aphA6 gene in MDR A. baumannii by PCR; Lane (L) shows 100-bp molecular size ladder, lane (P) is the positive control, lanes 1–11 are the positive samples carrying aphA6 gene (797 bp). Lane (N) is the negative control.
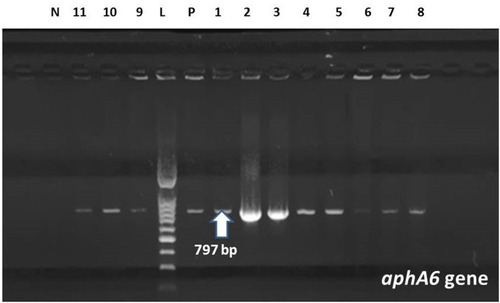
Figure 3 Amplification of aadA1 gene in MDR A. baumannii by PCR; Lane (L) shows 100-bp molecular size ladder. Lane (N) is the negative control. Lanes 3–6 are the positive samples carrying aadA1 gene (792 bp). Lanes 1.2 are negative samples. Lane (P) is the positive control.
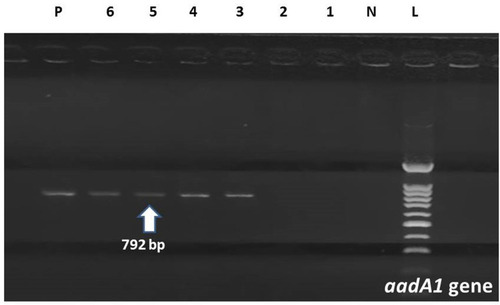
Table 3 Distribution of AME Resistance Genes According to the Clinical Isolates