Figures & data
Table 1 Primer Sequences for RT-qPCR
Figure 1 Mtb infection inhibits miR-340-5p expression in A549 cells. (A) miRs differentially expressed in peripheral blood of patients with Mtb and normal volunteers. (B) CFU analyzed the survival of Mtb in A549 cells infected with Mtb. (C) The viability of Mtb-infected A549 cells measured by MTT. (D) DNA synthesis of Mtb-infected A549 cells detected by EdU staining. (E) The cell cycle of Mtb-infected A549 cells examined by flow cytometry. (F) Release of pro-inflammatory factors in Mtb-infected A549 cells detected by ELISA. (G) miR-340-5p expression in Mtb-infected A549 cells at different time points examined by RT-qPCR. (H) Effect of Mtb infection with different MOI values for 48 hours on miR-340-5p expression in A549 cells determined by RT-qPCR. All cell experiments were repeated three times independently. One-way ANOVA (panels B/C/D/F/G/H) or two-way ANOVA (panel E) was used for comparisons among groups. vs 0 h or cells without infection (Control), *p < 0.05, **p < 0.01.
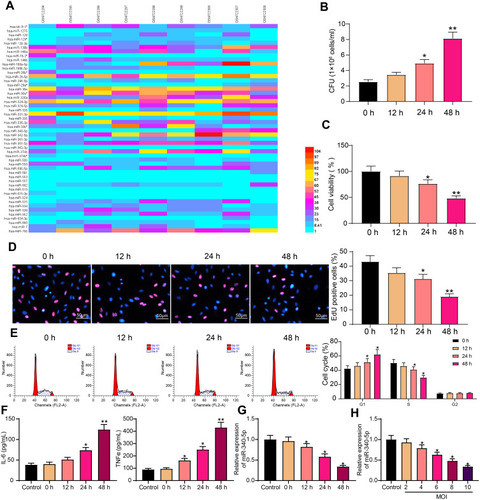
Figure 2 Overexpression of miR-340-5p attenuates the damage of Mtb infection to A549 cells. (A) miR-340-5p expression in A549 cells after miR-340-5p mimic transfection detected by RT-qPCR. (B) The viability of A549 cells measured by MTT. (C) The survival of Mtb in A549 cells analyzed by CFU. (D) DNA synthesis of A549 cells detected by EdU staining. (E) The cell cycle of A549 cells examined by flow cytometry. (F) Release of pro-inflammatory factors in A549 cells detected by ELISA. All cell experiments were repeated three times independently. Unpaired t test (panels A/B/C/D/F) or two-way ANOVA (panel E) was used for data comparisons. vs NC mimic, *p < 0.05.
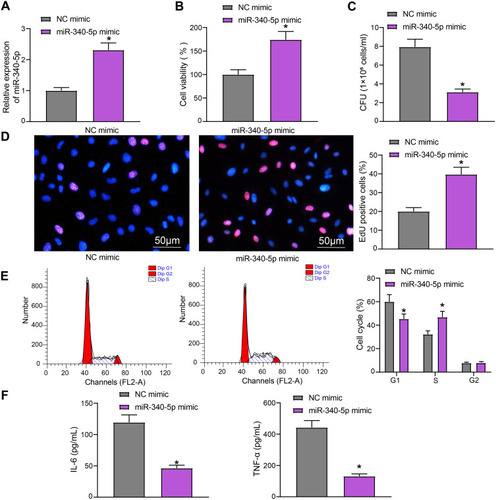
Figure 3 miR-340-5p targets TMED7 in A549 cells. (A) The target gene of miR-340-5p predicted by bioinformatics website. (B) The expression of potential target genes examined by RT-qPCR. (C) The potential binding sites between TMED7 and miR-340-5p. (D) the luciferase activity of WT-TMED7/MT-TMED7 validated by dual-luciferase assay. (E) The enrichment ability of anti-Ago2 to miR-340-5p and TMED7 examined by RIP assay. (F) TMED7 expression in A549 cells after Mtb infection detected by RT-qPCR. All cell experiments were repeated three times independently. One-way ANOVA (panel F or two-way ANOVA (panels B/D/E) was used for data comparisons. vs NC mimic, *p < 0.05; vs anti-IgG, #p < 0.05, ##p< 0.01; vs cells without infection (Control), @p < 0.05.
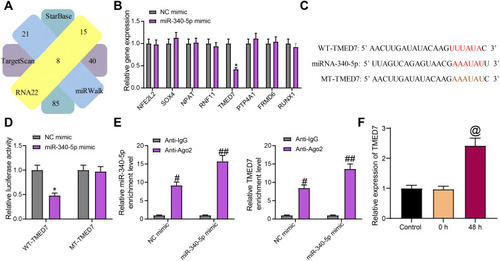
Figure 4 Overexpression of TMED7 attenuates the protective effect of miR-340-5p mimic on Mtb-infected A549 cells. (A) TMED7 expression after co-transfection detected by RT-qPCR. (B) the viability of A549 cells measured by MTT. (C) The survival of Mtb in A549 cells analyzed by CFU. (D) DNA synthesis of A549 cells detected by EdU staining. (E) The cell cycle of A549 cells tested by flow cytometry. (F) Release of pro-inflammatory factors in A549 cells detected by ELISA. All cell experiments were repeated three times independently. Unpaired t test (panels A/B/C/D/F) or two-way ANOVA (panel E) was used for data comparisons. vs miR-340-5p mimic + oe-NC, *p < 0.05.
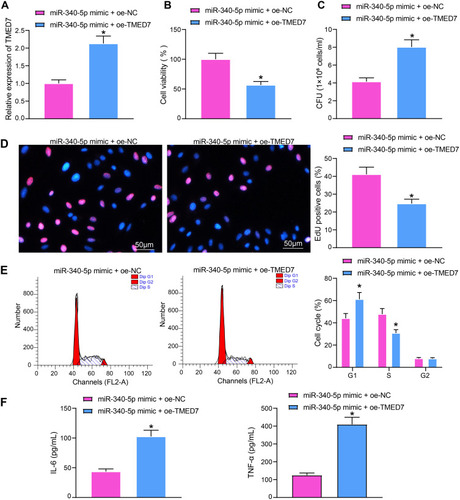
Figure 5 miR-340-5p targets TMED7 to mediate the NF-κB pathway. (A) TMED7 expression after co-transfection detected by RT-qPCR. (B) The levels of TMED7 and NF-κB protein were detected by WB after co-transfection. (C) WB detection of p-NFκB nuclear translocation. (D) TMED7 mRNA expression in cells under low MOI (4) by RT-qPCR. (E) WB detection of p-NFκB nuclear translocation in cells with low MOI (4). All cell experiments were repeated three times independently. One-way (A/D) or two-way ANOVA (B/C/E) was used for data comparisons. vs NC mimic, *p < 0.05; vs miR-340-5p mimic + oe-NC, #p < 0.05.
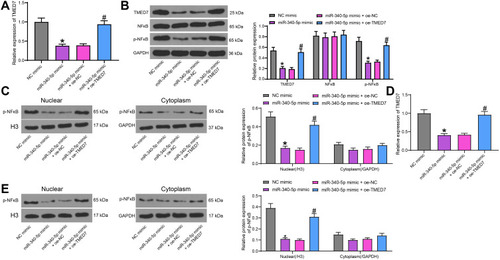
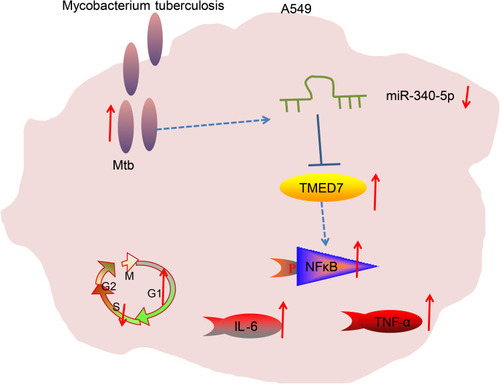
Figure 6 Mtb infection resulted in a significant decrease in miR-340-5p expression in A549 cells to promote TMED7/NFκB axis expression, causing cell cycle arrest and inflammation.