Figures & data
Figure 1 Schematic overview of host–pathogen interactions. (A) simplistic depiction of a pathogen (green hexagon in blue circle) surface protein (red circle) binding to a receptor (black Y-shape) on a host cell surface. (B) A generalized and simplified overview of a pathogen life-cycle stages involving interactions with the host cell.
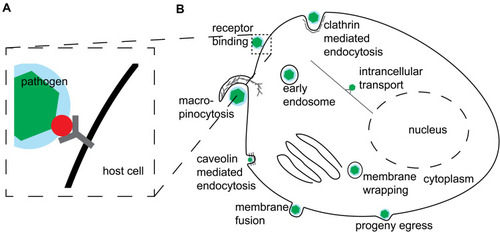
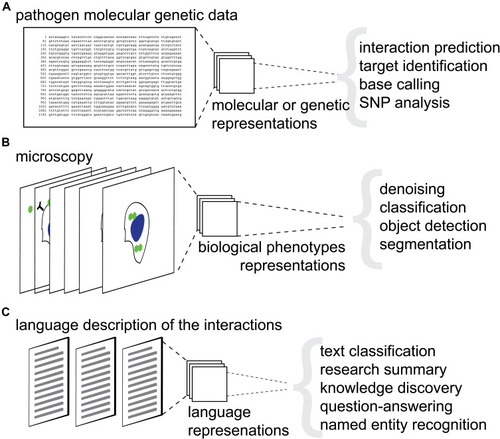
Figure 2 Overview of machine learning and artificial intelligence application for host–pathogens interactions research. (A) Schematic representation of machine learning applications for genetic and molecular data. (B) Schematic representation of machine learning applications for image data. (C) Schematic representation of machine learning applications for language data. Gray parathesis separate respective downstream tasks.