Figures & data
Table 1 Clinical Characteristics of the CRKP Strains
Table 2 Antimicrobial Susceptibility Patterns of CRKP Strains, % (n)
Figure 1 Minimum spanning trees of 94 CRKP isolates. Each node represents a single ST. The size of the nodes was proportional to the number of strains within the represent ST. The color distribution represents distribution of carbapenemase genes among different STs.
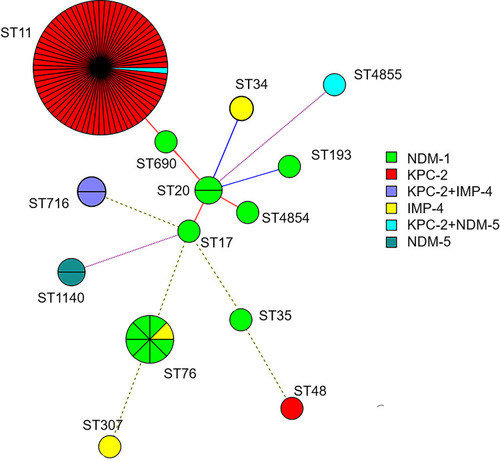
Figure 2 Dendrogram of PFGE profiles of 71 CRKP ST11 isolates. The UPGMA algorithm was performed to construct a dendrogram based on the dice similarity coefficient. Strains were classified as the same clone cluster when their dice similarity index was ≥80%.
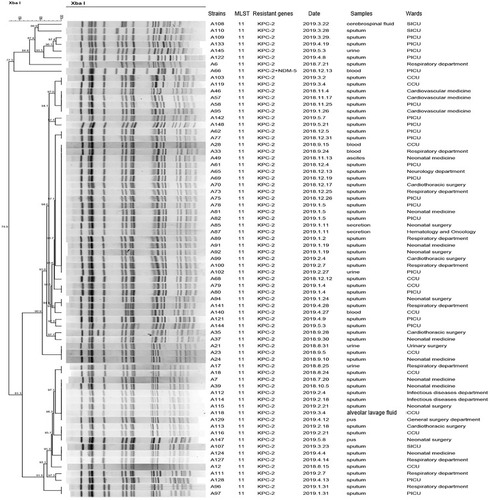
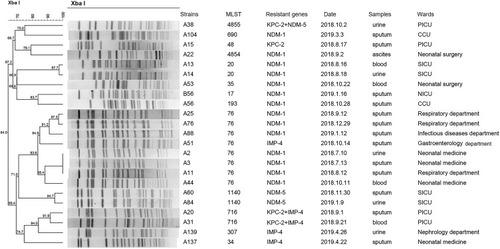
Figure 3 Dendrogram of PFGE profiles of 23 CRKP non-ST11 strains. The UPGMA algorithm was performed to construct dendrogram based on the dice similarity coefficient. Strains were classified as the same clone cluster when their dice similarity index was ≥80%.