Figures & data
Table 1 Nutritional and Immune Functional Indexes of 69 Patients with ARL with Different Clinical Outcomes (x̄±s)
Table 2 Univariate Analysis of the Clinical Characteristics and Prognosis of 69 Patients with ARL
Figure 1 The univariate survival function diagram of IPI, BMI, ALB, PA, and CD4 by the Kaplan–Meier method.

Table 3 Parameter Estimation and Test Results of the Cox Proportional Hazards Regression Model (χ2=38.107, P<0.001)
Figure 2 The multivariate survival function diagram of BMI, PA, and IPI score by the Cox risk regression analysis.
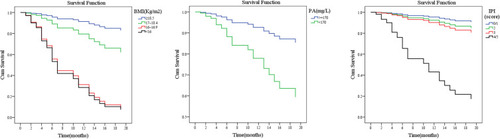
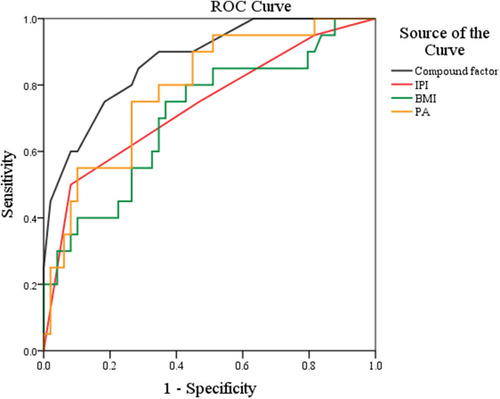
Table 4 The Area Under the Curve of the ROC of IPI, BMI, PA and the Composite Indicator (PA+IPI+BMI)
Figure 3 The ROC curve of IPI, BMI, PA, and the composite indicator (PA+IPI+BMI).