
Figures & data
Figure 1 Map of Ethiopia showing the study areas (Dendi, Cheliya and Toke Kutaye districts) where milk samples were collected from Zebu cows. The map was sketched using ArcGIS 9 software (ArcGIS™ version 10.7, California, USA).
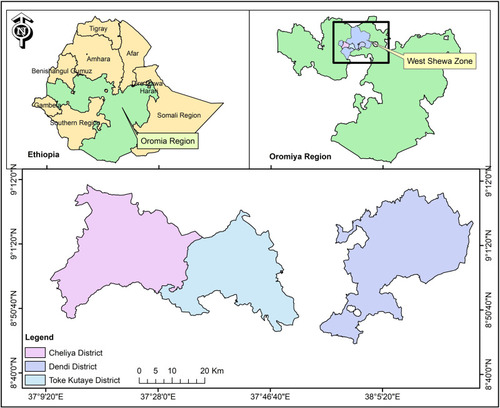
Table 1 Prevalence of Mastitis at the Cow and Quarter Level
Table 2 Isolation Rate of Staphylococcus Species from Mastitic Quarters of Zebu Cows in the Study Areas
Table 3 Logistic Regression Analysis of Potential Risk Factors for the Occurrence of Mastitis in the Study Area
Table 4 Antimicrobial Susceptibility Pattern of S. aureus, S. lentus, and S. sciuri Isolates