
Figures & data
Figure 1 Distribution of strains isolated from urine for the 9-year study.
Abbreviations:E. coli, Escherichia coli; K. pneumoniae, Klebsiella pneumoniae; P. aeruginosa, Pseudomonas aeruginosa; E. faecalis, Enterococcus faecalis; E. faecium, Enterococcus faecium.
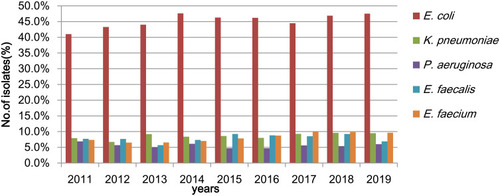
Table 1 Resistance Rates (%) of Urine K. pneumoniae Isolates to Antimicrobial Agents
Figure 2 Rates of ESBL-producing and Carbapenem resistant-K. pneumoniae from 2011 to 2019.
Abbreviations: CR-KPN, carbapenem resistant-K. pneumoniae; ESBL-KPN, ESBL-producing K. pneumoniae.
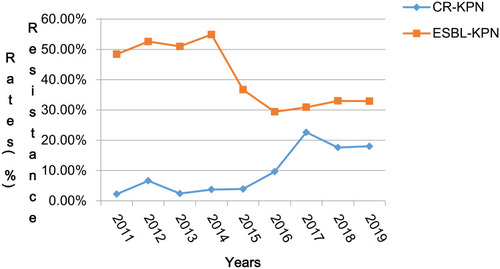
Table 2 Resistance Rates of Urine K. pneumoniae Isolates with Diverse Characteristics to Antimicrobial Agents