Figures & data
Table 1 List of Primers Used in the Current Study and Predicted Size of PCR Products
Figure 1 Distribution of isolates according to symptoms manifestation. Pie charts showing (A) the relative distribution of colonizing and infectious isolates, as well as (B) the detailed sites of isolation of both types.
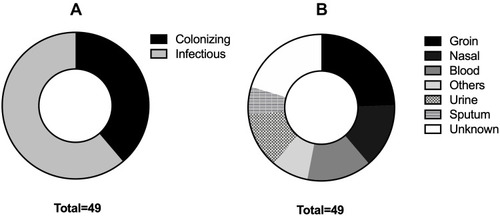
Figure 2 Distribution of biofilm formation ability among both colonizing and infectious isolates. (A) A stacked bar plot indicating the percentage of colonizing isolates with biofilm and non biofilm forming ability. (B) A stacked bar plot indicating the percentage of infectious isolates with biofilm and non biofilm forming ability. The X-axis represents the percentage of either biofilm forming isolates (dark grey bars) or non biofilm forming isolates (light grey bar). The number written inside each bar represents the number of isolates constituting the final percentage.
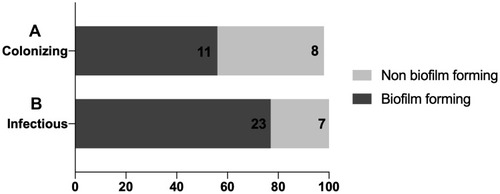
Figure 3 Minimum inhibitory concentration patterns. (A) Comparison of linezolid MICs of both colonizing and infectious isolates. (B) Comparison of vancomycin MICs of both colonizing and infectious isolates. Grey bars represent colonizing isolates and black bars representing infectious ones.
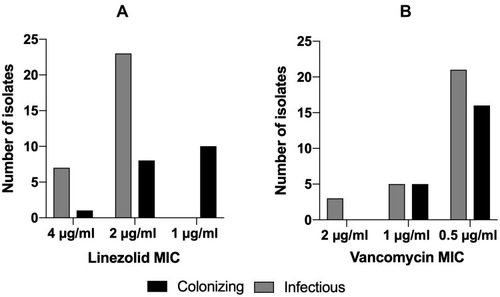
Figure 4 Antibiogram of the tested colonizing and infectious isolates. (A) Colonizing isolates antibiogram results tabular representation towards the 16 tested antibiotics. (B) Infectious isolates antibiogram results tabular representation towards the 16 tested antibiotics; classification was done as follows “resistant (R), intermediate (I) and sensitive (S)”. (C) Bar charts showing the percentages of resistant isolates towards the 16 different antibiotics used. The black bars represent the infectious isolates, and the grey bars represent the colonizing isolates.
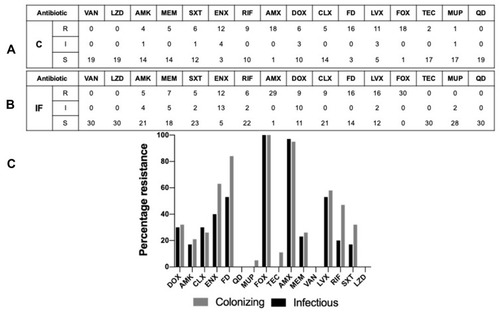
Figure 5 ERIC-PCR analysis of the tested MRSA isolates. Unweighted pair group method using arithmetic overage algorithm (UPGMA) clustering method, showing the genetic similarity among MRSA isolates by enterobacterial repetitive intergenic consensus (ERIC) genotyping. Radial dendrogram, in decreasing nodes order, was generated with FigTree v1.4.4. Blue labels represent the colonizing isolates and black labels represent the infectious isolates.
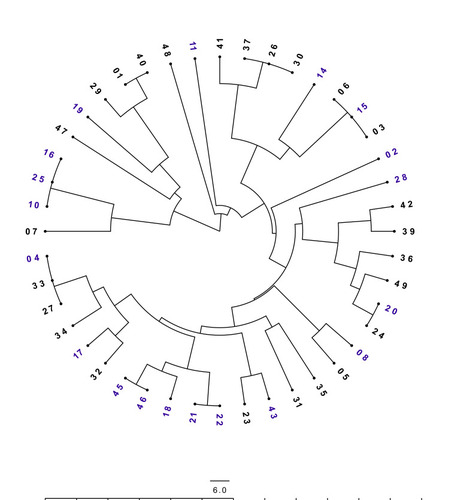
Table 2 MLST Results Using MLST Database (Bold), BLAST, or Both (Bold and Underlined)
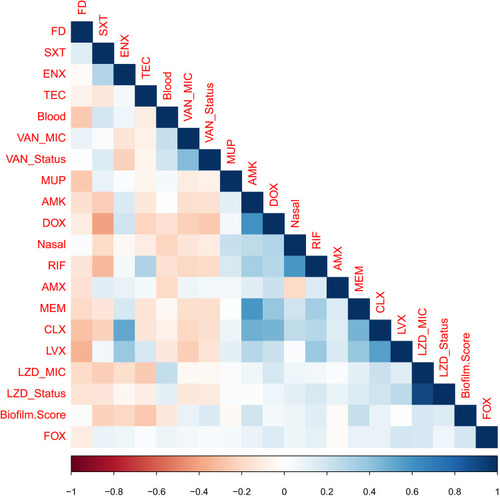
Figure 6 Phenotype-genotype correlation. Phenotype-genotype correlation matrix. A colored matrix representing the correlations between all possible pairs of phenotypes (isolate type, source, specimen, biofilm ability, and antibiogram) and tested genes of the whole isolates collection. Vancomycin and linezolid were not included as all isolates were sensitive to them. The color represents Pearson’s correlation coefficient and its intensity represents the coefficient’s value (shades of blue are positive correlations and shades of orange-brown are negative correlations). Figure labels for antibiotics; figure labels for biofilm. Score; strong biofilm forming=3, moderate biofilm forming=2, weak biofilm forming=3. Figure labels for minimum inhibitory concentration (MIC); LZD_Status= borderline or not borderline MIC and LZD_MIC=1, 2 and 4 µg/mL. The figure was generated using R-software.