Figures & data
Table 1 Characteristics of the Drug Resistance Genes and Results of 59 MBL-Producing GNOs in the Checkerboard Microdilution Assay [Number (Rate%)]
Figure 1 Results of the Enterobacteriaceae isolates in the checkerboard microdilution assay. (A) FICI values of Enterobacteriaceae isolates. The interpretation of the FICI was as follows: ≤0.5, synergy; >0.5 to <1, partial synergy; =1, additive; >1 to <4, indifference. The dashed line is the line that divides the different interpretations. (B) Reduced times of the MICATM and MICAMC in combination compared to the mono-antibiotic treatments. (C) MIC range of aztreonam in both the mono-ATM group and the combination group. (D) MIC range of amoxicillin/clavulanic acid both in the mono-AMC group and in the combination group.
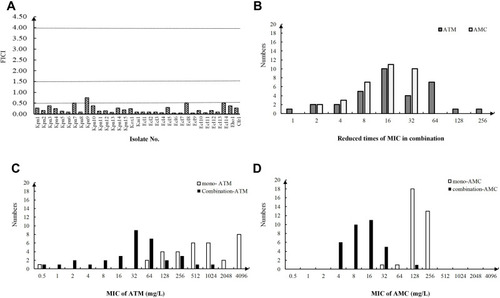
Figure 2 Time-kill curves of four representative Enterobacteriaceae isolates. (A) Isolate Kpn1; (B) isolate Kpn6; (C) isolate Kpn8; (D) isolate Ecl6. Each isolate was tested by five technical replicates and four biological replicates.
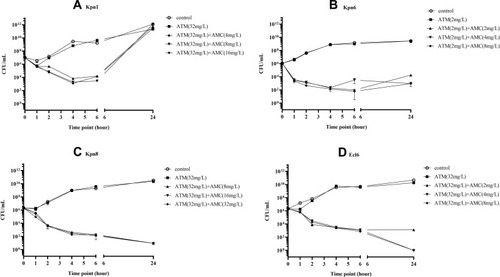
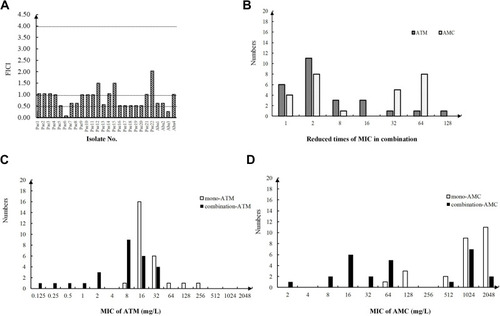
Figure 3 Results of the Pseudomonadales isolates in the checkerboard microdilution assay. (A) FICI values of Pseudomonadales isolates. The interpretation of the FICI was as follows: ≤0.5, synergy; >0.5 to <1, partial synergy; =1, additive; >1 to <4, indifference. The dashed line is the line that divides the different interpretations. (B) Reduced times of the MICATM and MICAMC in combination compared to the mono-antibiotic treatments. (C) MIC range of aztreonam in both the mono-ATM group and the combination group. (D) MIC range of amoxicillin/clavulanic acid both in the mono-AMC group and in the combination group.