Figures & data
Figure 1 The chest CT image dataset (A is COVID-19, B is non-COVID-19).
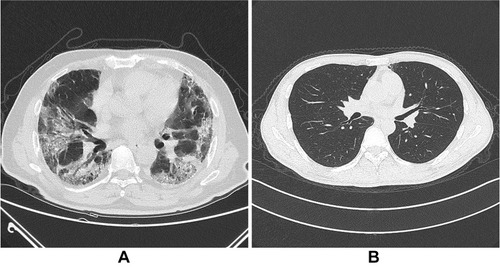
Figure 2 The overall schematic diagram of GARCD.
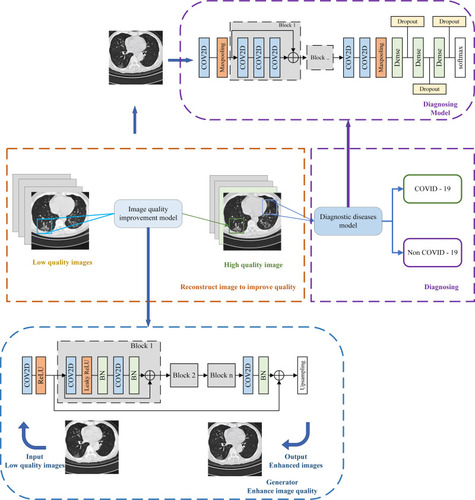
Figure 3 Schematic diagram of the image quality improvement module.
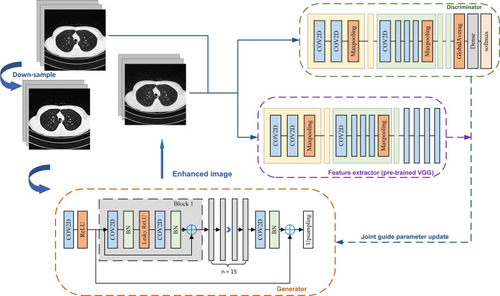
Figure 4 CT images processed by different methods (A is raw data. B is image with missing lesion features. C is image with Gaussian noise. We compare the differences between the processed image and the original image to determine whether MSE, PSNR and SSIM are suitable to guide the optimization of the model’s global parameters. MSE means mean squared error, PSNR means peak signal-to-noise ratio, SSIM means structural similarity.The arrow points to the lesion.).
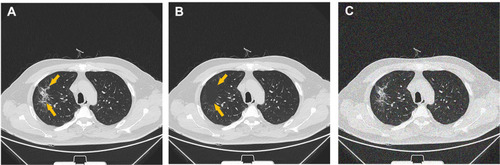
Table 1 MSE, PSNR, SSIM Between Different Images
Figure 5 Schematic diagram of disease diagnosis module.
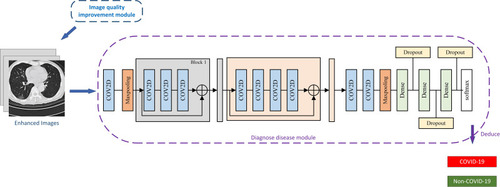
Figure 6 Image quality improvement module processing results of low-quality images.
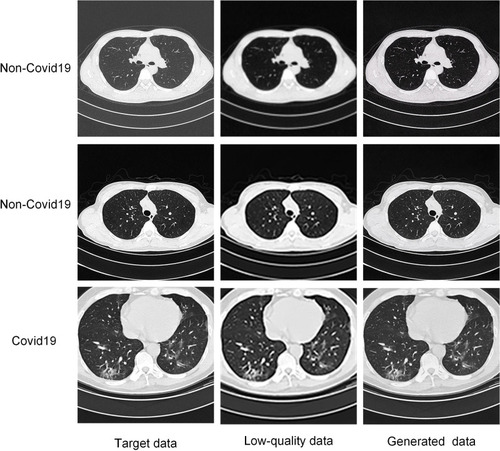
Table 2 Evaluation Standard
Figure 7 Score distribution of low-quality images and enhanced images (A is the score distribution of low-quality images. B is the score distribution of enhanced images. It reflects the auxiliary potential of the image quality improvement module for actual clinical researchers.).
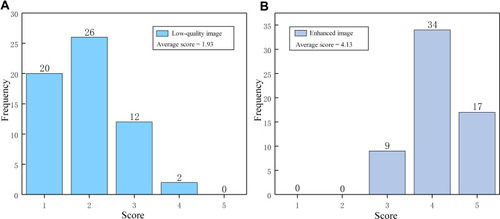
Figure 8 The average loss curve of disease diagnosis module in this study using 10-fold cross-validation.
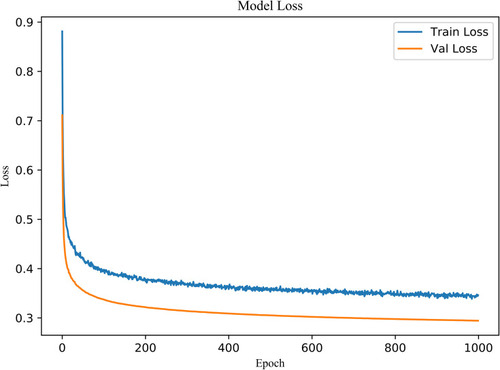
Figure 9 ROC curves of different models in the same test dataset.
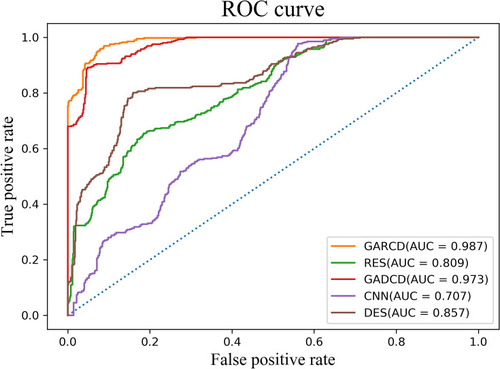
Figure 10 Precision-recall curve and sensitivity–specificity curve of different model (A is precision–recall curve of GARCD and GADCD, B is sensitivity–specificity curve of GARCD and GADCD.).
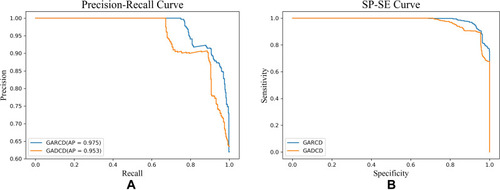
Table 3 The Recognition Performance of Each Model on the Same Low-Quality Image (AUC Means Area Under Receiver Operating Characteristic Curve, AP Means Average Precision)
Table 4 Best Performance of Different Related Work (AUC Means Area Under Receiver Operating Characteristic Curve, SE Means Sensitivity, SP Means Specificity)
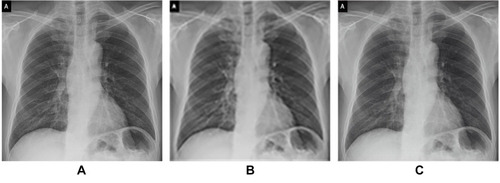
Figure 11 GARCD also has the potential to be applied to other types of medical imaging, such as X-ray (A is raw data, B is low-quality image, C is generated high-quality images).