Figures & data
Figure 1 Morphological characteristics of T. marneffei. The fungi presented greenish-yellow colonies of rose-red pigment at 27°C PDA culture medium (A) and Gray-white cheese-like colony without pigment at 37°C SDA culture medium (B). Stained with lactophenol cotton blue, the fungi showed brush-like structure at 27°C (C), and oval yeast-like cells at 37°C (D).
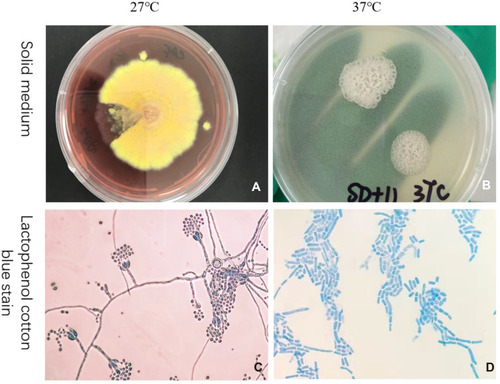
Figure 2 The DNA electrophoresis results (left) and the electrophoresis result of PCR amplification products (right).
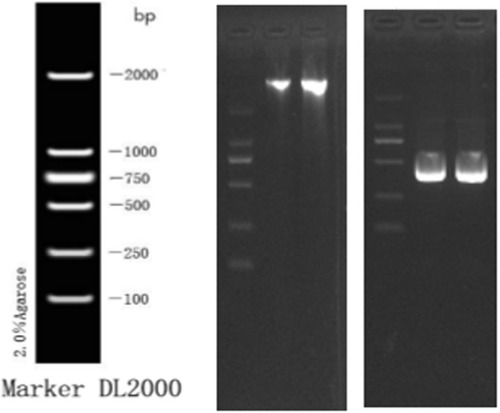
Figure 3 The morphologic changes of macrophages infected with TM conidia were observed by inverted microscope. With the prolongation of the infection process, the gemmation of conidia and mycelia increased, nutrient consumption in supernatant increased, the macrophages deformation, disintegration and death increased (B, D and F) compared with the control group (A, C and E). Light microscopy 400×.
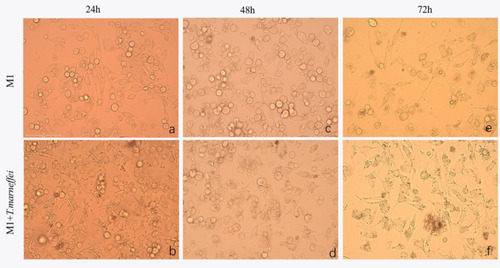
Figure 4 CD86 expression of T. marneffei protein was detected by Western blot. There was no positive band of 80kd compared with the protein from M1 macrophage.
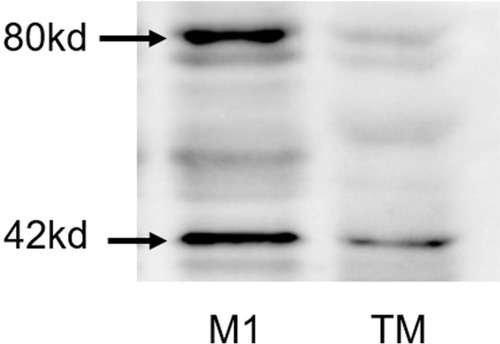
Figure 5 CD86 expression of T. marneffei and Candida albicans detected by IEM. (A) Colloidal gold particles (arrow point) were specifically adsorbed on T. marneffei after co-culturing with M1 macrophages for 24hrs detected by IEM. ×8.0k 100kv. No colloidal gold particles were found either on T. marneffei (B) or Candida albicans (C) growing at 37°C BHI detected by IEM. The same was true when candida albicans co-cultured with macrophages (D). (B ×8.0k 80kv. C ×5.0k 100kv. D ×8.0k 80kv).
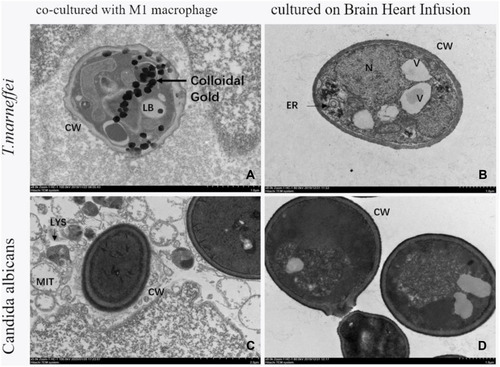
Figure 6 The fluorescence intensity of CD86 in macrophages. (A–G) It was significantly decreased when infected with T. marneffei at 72 hours compared with the control group (*p < 0.05), but there was no significant change either at 24 hours or 48 hours (nsp > 0.05).
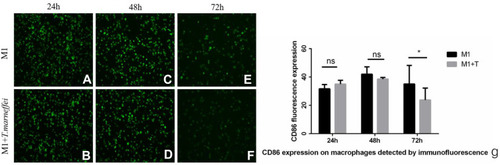
Figure 7 The relative expression of CD86 in macrophages. It was significantly decreased when infected with T. marneffei at 72 hours compared with the control group (*p < 0.05), but there was no significant change either at 24 hours or 48 hours (nsp > 0.05).
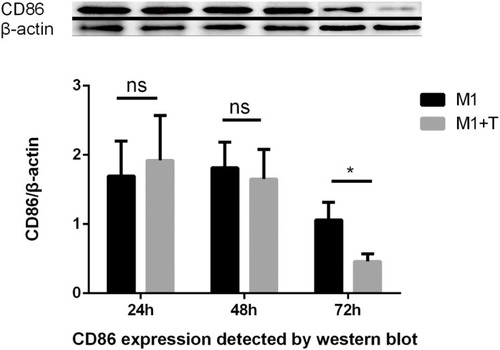
Figure 8 The change trend of CD86 expression of macrophages and supernatant detected by ELISA. (A) Compared with the control group, the expression of CD86 on macrophages was significantly decreased when incubated with T. marneffei at 72 hours (*p < 0.05), while the content of CD86 in supernatant was significantly increased at 72 hours (*p < 0.05) detected by ELISA. However, there was no significant change of the expression of CD86 on macrophages either at 24 hours or 48 hours (nsp > 0.05), nor did the content of CD86 in supernatant (nsp > 0.05). (B) The change trend of CD86 expression in line chart.
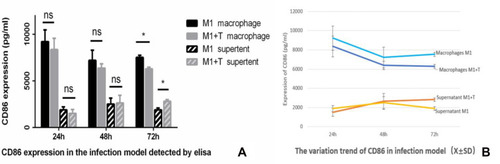
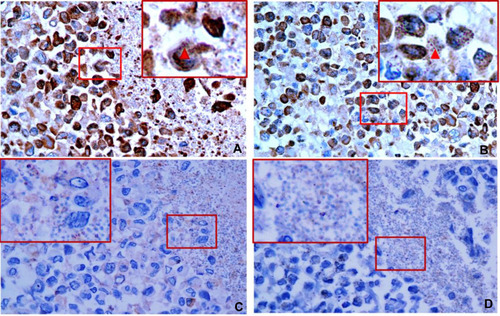
Figure 9 The expression of CD86, CD163 and CD1a on M1 macrophages were detected by immunohistochemistry after co-culturing with T. marneffei conidia for 24 hours. Macrophages and T. marneffei were CD86 positive (A and B) but CD163 (C) and CD1a (D) negative detected by immunohistochemistry. CD86-positive T. marneffei conidia were indicated by the red arrows. Hematoxylin and eosin (H&E) ×400.