
Figures & data
Table 1 Pathogens Used in the Current Study
Table 2 The HBV-MCDA Primers Used in the Current Study
Figure 1 Sequence and location of the MCDA primers targeting the HBV special S gene. The nucleotide sequence of the sense strand of the HBV S gene was showed in the chart. Right arrows and left arrows indicate sense and complementary sequences which were used in current study, respectively.
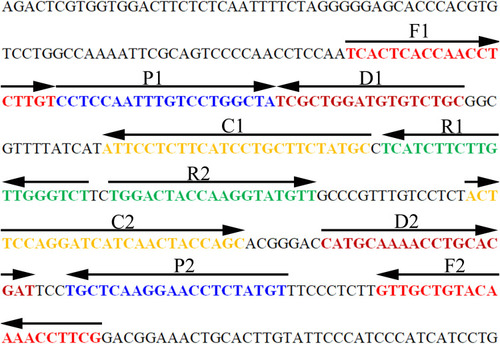
Figure 2 Determination and verification of HBV-MCDA amplification products. (A) The HBV-MCDA amplification products were analyzed with MG reagents through visually observation of the color change. (B) Nanoparticles-based lateral flow biosensor was used for visual detection of HBV-MCDA products. Tube 1/Biosensor 1: positive amplification of HBV standard substance (the Chinese Academy of Metrology); Tube 2/Biosensor 2: negative amplification of HCV (standard substance, The Chinese Academy of Metrology); 3: negative amplification of HIV (standard substance, The Chinese Academy of Metrology); Tube 4/Biosensor 4: blank control (DW).
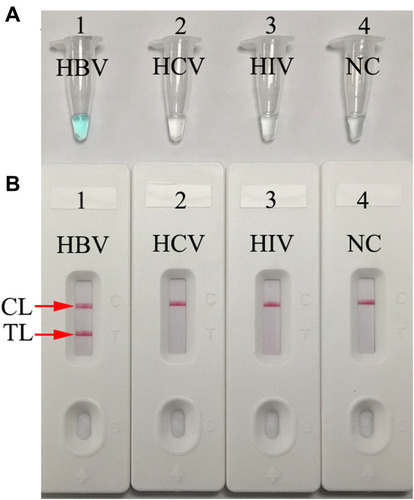
Figure 3 Optimal reaction temperature for the set of HBV-MCDA primers. The MCDA reactions for detection of HBV were measured with real-time turbidity (LA-500), and the corresponding curves of DNA concentrations were showed in the charts. The threshold value was 0.1, and the turbidity > 0.1 was considered as positive amplification. Eight kinetic graphs (A–H) were obtained at different temperatures (60–67°C, 1°C intervals) with 100 IU target genomic DNA per reaction. The graphs from (E) (64°C) to (H) (67 °C) presented robust amplification. The optimal HBV-MCDA reaction temperature was 64°C.
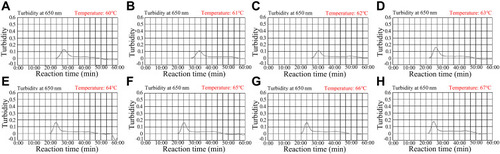
Figure 4 Sensitivity analysis of the HBV-MCDA-LFB assay with serially diluted genomic DNA templates of HBV. Two MCDA product analysis methods, colorimetric indicator (MG) (A), and lateral flow biosensor (B) were applied for identifying HBV-MCDA amplification products. Tubes A1–A7 (Biosensors B1–B7) represent the genomic DNA level of 5.0×10³ IU, 5.0×10² IU, 50 IU, 5 IU, 0.5 IU, 0.05IU per reaction and blank control (DW), respectively. The LoD of the HBV-MCDA-LFB assay for S gene detection was 5 IU of genomic DNA template per reaction.
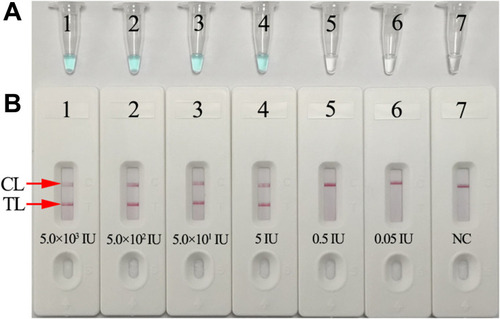
Figure 5 Optimal amplification time for HBV-MCDA-LFB assay. Four different reaction times (A, 25 min; B, 35 min; C, 45 min; D, 55 min) were tested and compared at 63°C. Biosensors 1–7 represent HBV genomic DNA levels of 5.0×10³ IU, 5.0×10² IU, 50 IU, 5 IU, 0.5 IU, 0.05IU per reaction and blank control (DW), respectively. The best sensitivity was observed when the reaction lasted for 35 min.
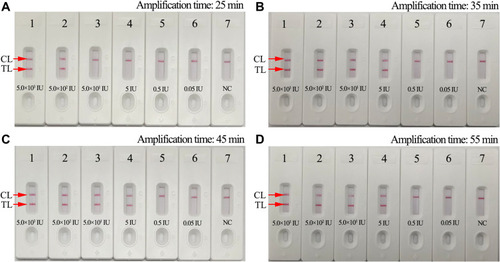
Figure 6 Analytical specificity of HBV-MCDA-LFB assay with different pathogens. The HBV-MCDA-LFB assay was evaluated with different genomic RNA/DNA as templates. Biosensor 1, HBV (standard substance); Biosensor 2–19, HBV (clinical samples); Biosensor 20, HCV (standard substance); Biosensor 21, HIV (standard substance); Biosensor 22, Respiratory syncytial virus type A; Biosensor 23, Adenoviruses; Biosensor 24, Human rhinovirus; Biosensor 25, Mycoplasma pneumonia; Biosensor 26, Pseudomonas aeruginosa; Biosensor 27, Haemophilus influenza; Biosensor 28, Streptococcus pyogenes; Biosensor 29, Acinetobacter baumannii; Biosensor 30, Leptospira interrogans; Biosensor 31, Mycobacterium tuberculosis; Biosensor 32, Hemophililus parainfluenza; Biosensor 33, Candida glabrata; Biosensor 34, Shigella flexneri; Biosensor 35, Staphylococcus aureus; Biosensor 36, Cryptococcus neoformans; Biosensor 37, Enteropathogenic Escherichia coli; Biosensor 38, Bordetella pertussis; Biosensor 39, Bacillus cereus; Biosensor 40, blank control.
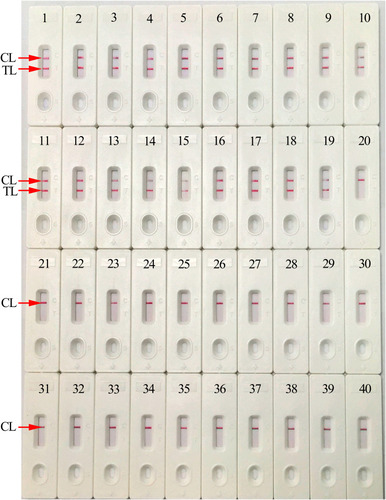
Table 3 Comparison of qPCR and HBV-MCDA-LFB Methods to Detect HBV Agent in Clinical Samples