
Figures & data
Table 1 MIC Values of H. pylori Strain Used
Table 2 PCR Primers
Figure 1 Inhibition of H. pylori growth at a disulfiram concentration of 1 µg/mL. (A) Drug-sensitive strain, (B) amoxicillin-resistant strain, (C) clarithromycin-resistant strain, and (D) metronidazole-resistant strain. The vertical axis represents the absorbance at OD600 nm, and the horizontal axis represents the number of days of the culture. Numbers in parentheses indicate the disulfiram concentration (µg/mL).
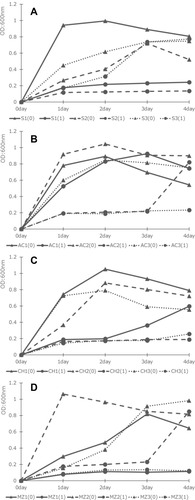
Figure 2 Bacterial morphology and colonies. (A) Morphology of H. pylori growth in BHI broth without disulfiram, (B) morphology of H. pylori with 1μg of disulfiram. After cultivation in broth, bacteria were inoculated on BHI agar. (C) Colony of H. pylori transferred from BHI broth without disulfiram, (D) colony of H. pylori transferred from BHI broth with 1μg of disulfiram.
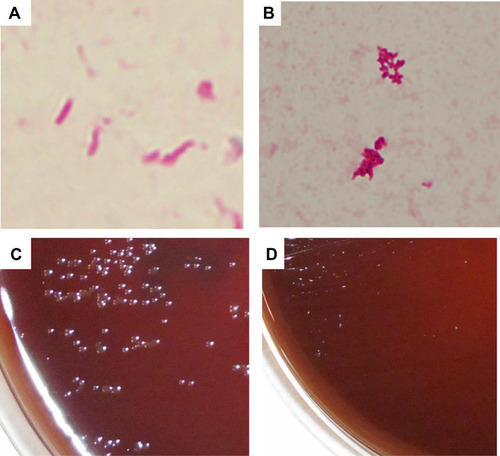
Figure 3 H. pylori pathogenic protein expression level. (A) Drug-sensitive strain, (B) amoxicillin-resistant strain, (C) clarithromycin-resistant strain, and (D) metronidazole-resistant strain. The vertical axis represents the protein expression level.
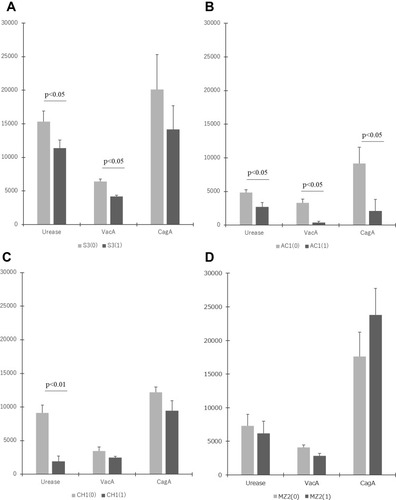
Table 3 16S rDNA Sequence