Figures & data
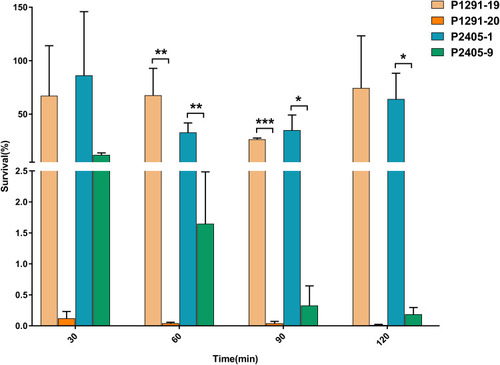
Figure 1 Distribution of genotypes among carbapenemase-producing strains of Klebsiella pneumoniae strains. Genotype distribution of isolates based on (A) multi locus sequence typing (MLST) analysis and (B) core genome multi locus sequence typing (cgMLST) scheme. (C) Distribution of CT types within the ST11 group.
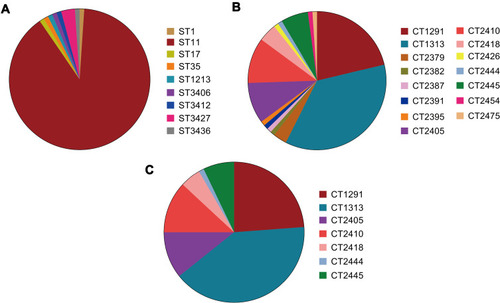
Figure 2 Timelines of the CT type isolates in the ST11 group, and the evolutionary relationships among these isolates. (A) Sampling dates for each isolate. Vertical lines represent the isolates in each CT group. There are 33, 10, 9, 1, 20, 4 and 6 isolates in the CT1313 (P1313-1 to P1313-33), CT2410 (P2410-1 to P2410-10), CT2405 (P2405-1 to P2405-9), CT2444 (P2444), CT1291 (P1291-1 to P1291-20), CT2418 (P2418-1 to P2418-4), and CT2445 (P2445-1 to P2445-6) group, respectively. (B) Minimum spanning tree based on cgMLST scheme analysis of the different CT types in the ST11 group of carbapenemase-producing K. pneumoniae. Each circle represents the isolates belonging to the corresponding CT type, based on the sequence analysis of 2358 cgMLST target genes. The code in each circle is the case serial number. The numbers on the branches represent the number of alleles between each pair of genes. The cluster distance threshold is 15. The arrows indicate evolution direction.
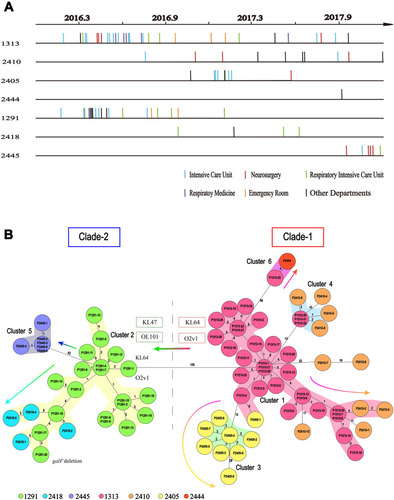
Figure 3 The phylogenetic trees of CT1291 and CT2405. Visualization of the core genomes of (A) CT1291 and (B) CT2405, as aligned with the Harvest suite. The leaves of the reconstructed phylogenetic tree (left) are paired with the corresponding row in the multiple sequence alignment. P1291-20 and P2405-9 have been selected (left: highlighted in aqua; right: highlighted in black). A SNP density plot (lilac line) reveals the phylogenetic signature of several clades. The light gray regions flanking the operon indicate unaligned sequences. The blue dotted box indicates the zone with a high frequency of SNPs and the corresponding genes in P2405-9.
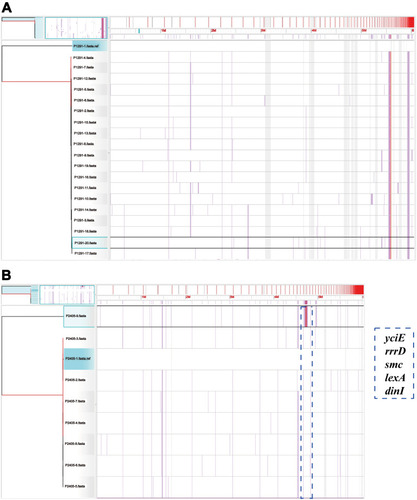
Figure 4 The viability of isolates in serum. P1291-19 and P2405-1 were randomly selected, and the viability of each of these isolates in serum was compared to that of the last isolate in each corresponding CT group (P1291-20 and P2405-9, respectively) (n=3, *P<0.05, **P<0.01, ***P<0.001).