Figures & data
Table 1 The Identified Nine Plausible SARIMA Methods and Their Information Criteria
Table 2 Statistical Test of the Estimated Parameters for the Optimal SARIMA (2,0,0)(2,1,0)12 Method
Figure 1 Estimated autocorrelogram and partial autocorrelogram of the residual sequence to forecast the TB epidemic patterns using (A) SARIMA model, (B) basic NARNN model, (C) traditional SARIMA-NARNN hybrid model, and (D) novel EEMD-SARIMA-NARNN hybrid model. As seen, the estimated autocorrelations and partial autocorrelations of the errors from the different models almost fell into the 95% confidence intervals (CIs) with few exceptions, such as the autocorrelations at lags 15 and 19 and partial autocorrelations at lags 15 in (A), and autocorrelations and partial autocorrelations at lag 11 in (D), these are also reasonable because higher-order autocorrelations and partial autocorrelations easily exceed the 95 CIs by chance.
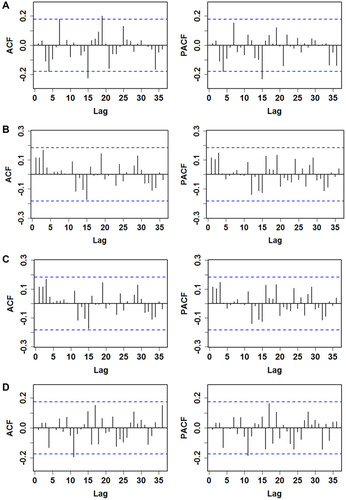
Table 3 The Estimated Parameters of the Optimal NARNN Models for the Original Series and Decomposed Series Using the EEMD Method
Table 4 Statistical Test of the Estimated Parameters for the Optimal SARIMA (1,2,0)(1,0,1)12 Method
Figure 2 Intrinsic mode functions (IMFs) and residue components of the original TB incidence series using the EEMD.
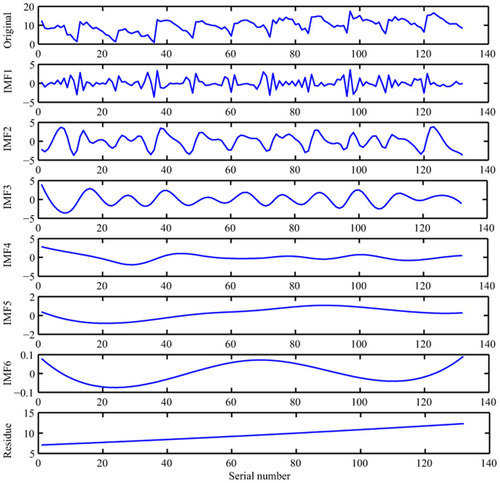
Figure 3 Estimated autocorrelogram of the residual sequence to forecast the six intrinsic mode functions (IMFs) decomposed by the EEMD method using the SARIMA-NARNN hybrid model. (A) IMF1, (B) IMF2, (C) IMF3, (D) IMF4, (E) IMF5, and (F) IMF6. For the estimated autocorrelations of the residual series from the different IMFs, all of them are inside of the 95 CIs except for the one at lag zero, meaning that there is no correlated serial in the residuals of the best-fitting SARIMA-NARNN hybrid model. Thereby, there appears to be adequate and reasonable for forecasting upcoming epidemiological trends using these best-fitting models.
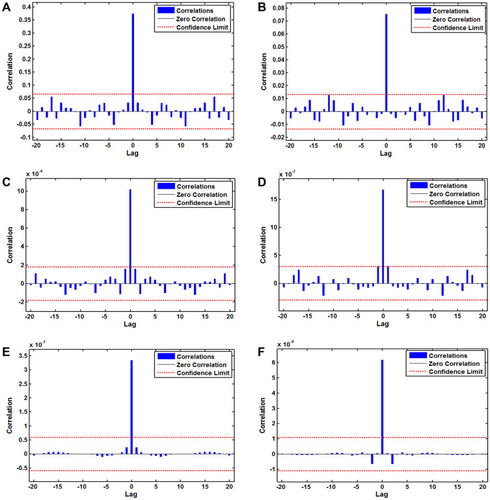
Table 5 Comparisons of the Fitted and Forecasted Accuracy Levels Among the Optimal Four Methods
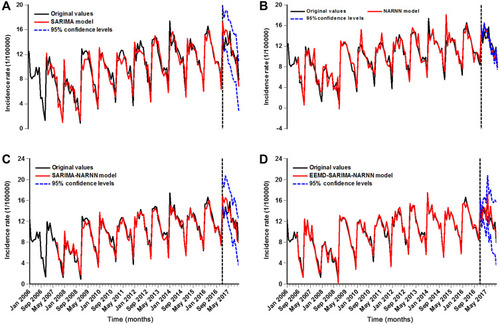
Figure 4 Time series plot showing the comparative results between original observations and fitted and predicted values using the selected best-fitting (A) SARIMA model, (B) NARNN model, (C) traditional SARIMA-NARNN hybrid model, and (D) novel EEMD-SARIMA-NARNN hybrid model (The curve at the left of the vertical black dotted line represents the fitted values, whereas the curve at the right denotes the forecasted values). As shown, the produced curve from the EEMD-SARIMA-NARNN hybrid model is closer to the actual both in the fitted and predicted aspects compared with the curves from the other models.