
Figures & data
Table 1 Primers Used in the Amplification of Selected Genes
Table 2 Distribution of Cases According to Service and Intensive Care Units
Table 3 Comparison of Demographic and Pathological Characteristics of HAI (n=27) and CAI (n=43) Groups
Table 4 Diagnosis, Clinical Features and Risk Factors of HAI (n =27) and CAI (n =43) Groups
Table 5 Resistance Rates of P. aeruginosa Isolates
Table 6 β-Lactamase Genes Identified in P. aeruginosa Isolates
Figure 1 PFGE analysis of P. aeruginosa isolates generated seven major clusters (profile 1 (A1, A2, B, C, D, E), F1a, F1b, F1c, F2, G1 and G2). Community-associated samples were shown as underlined.
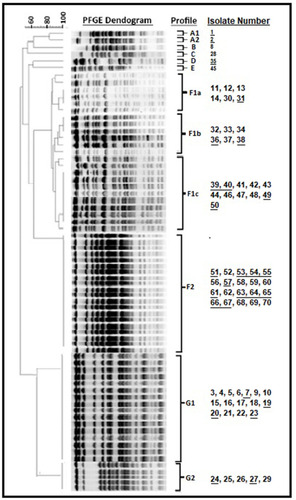
Table 7 Epidemic Characteristics of 6 Patients in Which Other Microorganisms Were Isolated in Addition to P. aeruginosa