
Figures & data
Figure 1 Flow chart of the study.
Abbreviations: RUT, rapid urease test; WS, Warthin-Starry staining; NGS, next-generation sequencing; UBT, 13C-urea breath test; ITT, intention-to-treat; PP, per-protocol.
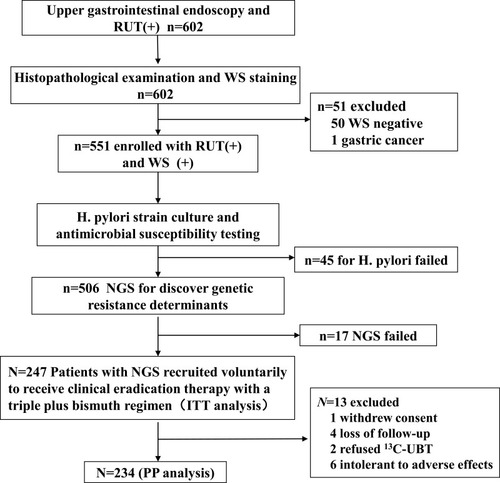
Table 1 Comparision Between Genotypes and Phenotypes of Antibiotic Resistance
Table 2 The Relationship Between Genotype Resistance of Clarithromycin and Eradication Efficacy
Table 3 The Relationship Between the Baseline at Enrollment and the Antibiotic Resistance of Pylori Isolates by NGS