
Figures & data
Table 1 Susceptibility Results for Klebsiella pneumoniae in Cerebrospinal Fluid Collected on Different Date in case 1
Table 2 CSF Analyses of Case 1 on Different Date
Figure 1 Brain computed tomography scan of case 1. (A and B) CT images show pus gathering in the subcutaneous tissues. (C) CT images show the pus gathering in the cisterns of interhemispheric fissure (red arrows).
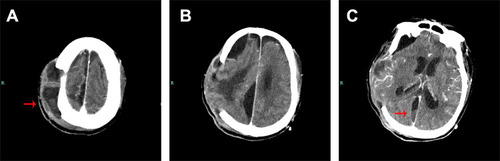
Figure 2 Summary of the clinical treatment process of Case 1.
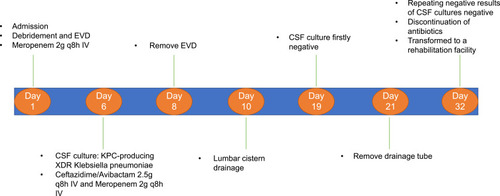
Table 3 Susceptibility Results for Klebsiella pneumoniae in Cerebrospinal Fluid Collected on Different Date in case 2
Table 4 Susceptibility Results for Pseudomonas aeruginosa in Sputum Collected on Different Date
Table 5 CSF Analyses of Case 2 on Different Date
Figure 3 Brain computed tomography scan of case 2. (A) The CT images show blocking of the right lateral ventricle but with obvious enlargement of the left lateral ventricle and the fourth ventricle, which indicate separation of the ventricular system. (B) Red arrow show the drainage tube.
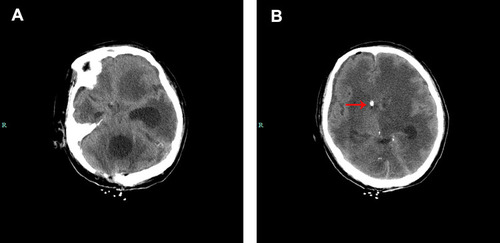
Figure 4 Schematic presentation of the clinical treatment process for Case 2.
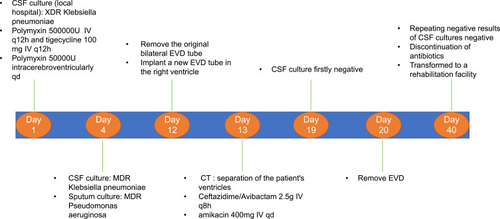
Table 6 CSF Analyses of Case 3 on Different Date
Table 7 Susceptibility Results for Pseudomonas aeruginosa in Cerebrospinal Fluid Collected on Different Date
Figure 5 Schematic presentation of the clinical treatment process for Case 3.
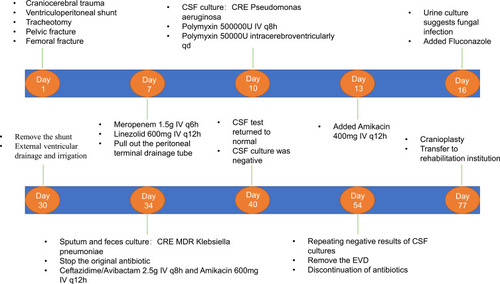
Table 8 Summary of Ceftazidime–Avibactam Used for CNS Infections Caused by MDR K. pneumoniae and MDR P. aeruginosa