
Figures & data
Table 1 Distribution of ESKAPE pathogens in Various Specimens
Table 2 Antimicrobial Resistance Pattern of Gram-Positive Isolates of ESKAPE Pathogens
Table 3 Antimicrobial Resistance Pattern of Gram-Negative Isolates of ESKAPE Pathogens
Table 4 Frequency of ESBL, MBL, MDR and XDR Among ESKAPE Pathogens
Figure 1 Gel Electrophoresis of PCR amplification of Van A gene. Lane 1 indicates DNA Ladder (1 Kbp), Lane 2: Blank (Negative Control), Lane 3: Positive Control, Lane 4,5,6,7,8 VRE clinical isolate positive with van A gene.
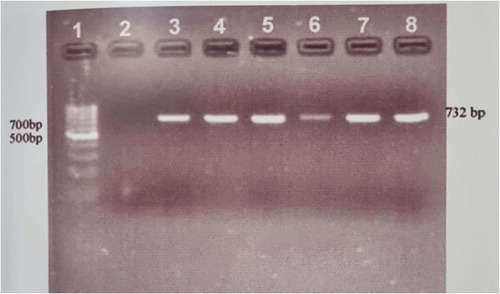
Table 5 Biofilm Producing ESKAPE Pathogens