
Figures & data
Table 1 Relative PFU/mL (EOP) and Resistance Frequency of QAB 3.4 in Clinical Strains
Figure 1 Phage-Bacteria co-culture assays. A: Bacterial growth curves at various MOI. B: Bacterial growth after 48 h of phage-bacteria co-culture. C: Phage stability test at various storage temperatures.
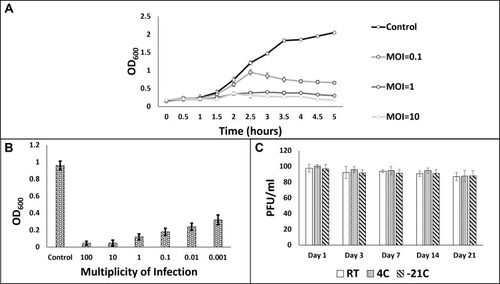
Table 2 Colony Forming Units (CFU/µL) of Acinetobacter baumannii from Phenol-, Saline- and Phage-Exposed Surfaces