Figures & data
Table 1 Rate of adverse incidents reported each year at one dental hospital, 2005–2009
Table 2 Rate of adverse incidents reported each month over a 6-year period at one dental hospital
Figure 1 Average number of adverse incidents that occurred each month compared with the average that occurred over the 6-year period (n = 287).
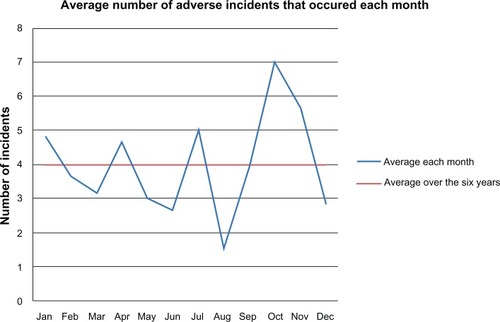
Figure 2 Reported cause of adverse incidents at the dental hospital (n = 287).
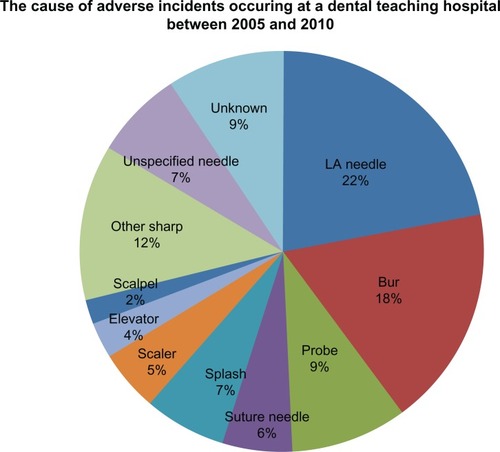
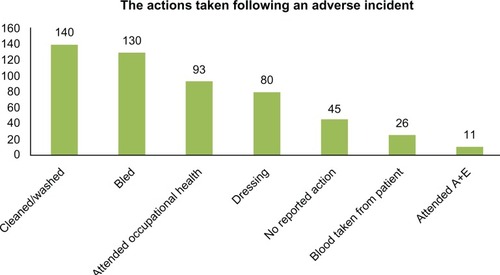
Figure 3 Reported actions taken following an adverse incident at one dental hospital, 2005–2009 (n = 242).
Note: More than one action was taken following a number (69%, n = 168) of the adverse incidents which reported an outcome.